Topology
Technical Documentation
A comprehensive mathematical treatment of the full computational pipeline: from neural spike data to predictive models of manifold dynamics.
READ TECHNICAL OVERVIEW →Analytical Pipeline
From Raw Data to Geometry: The analysis transforms high-dimensional neural spike data through multiple stages to reveal intrinsic geometric structure.
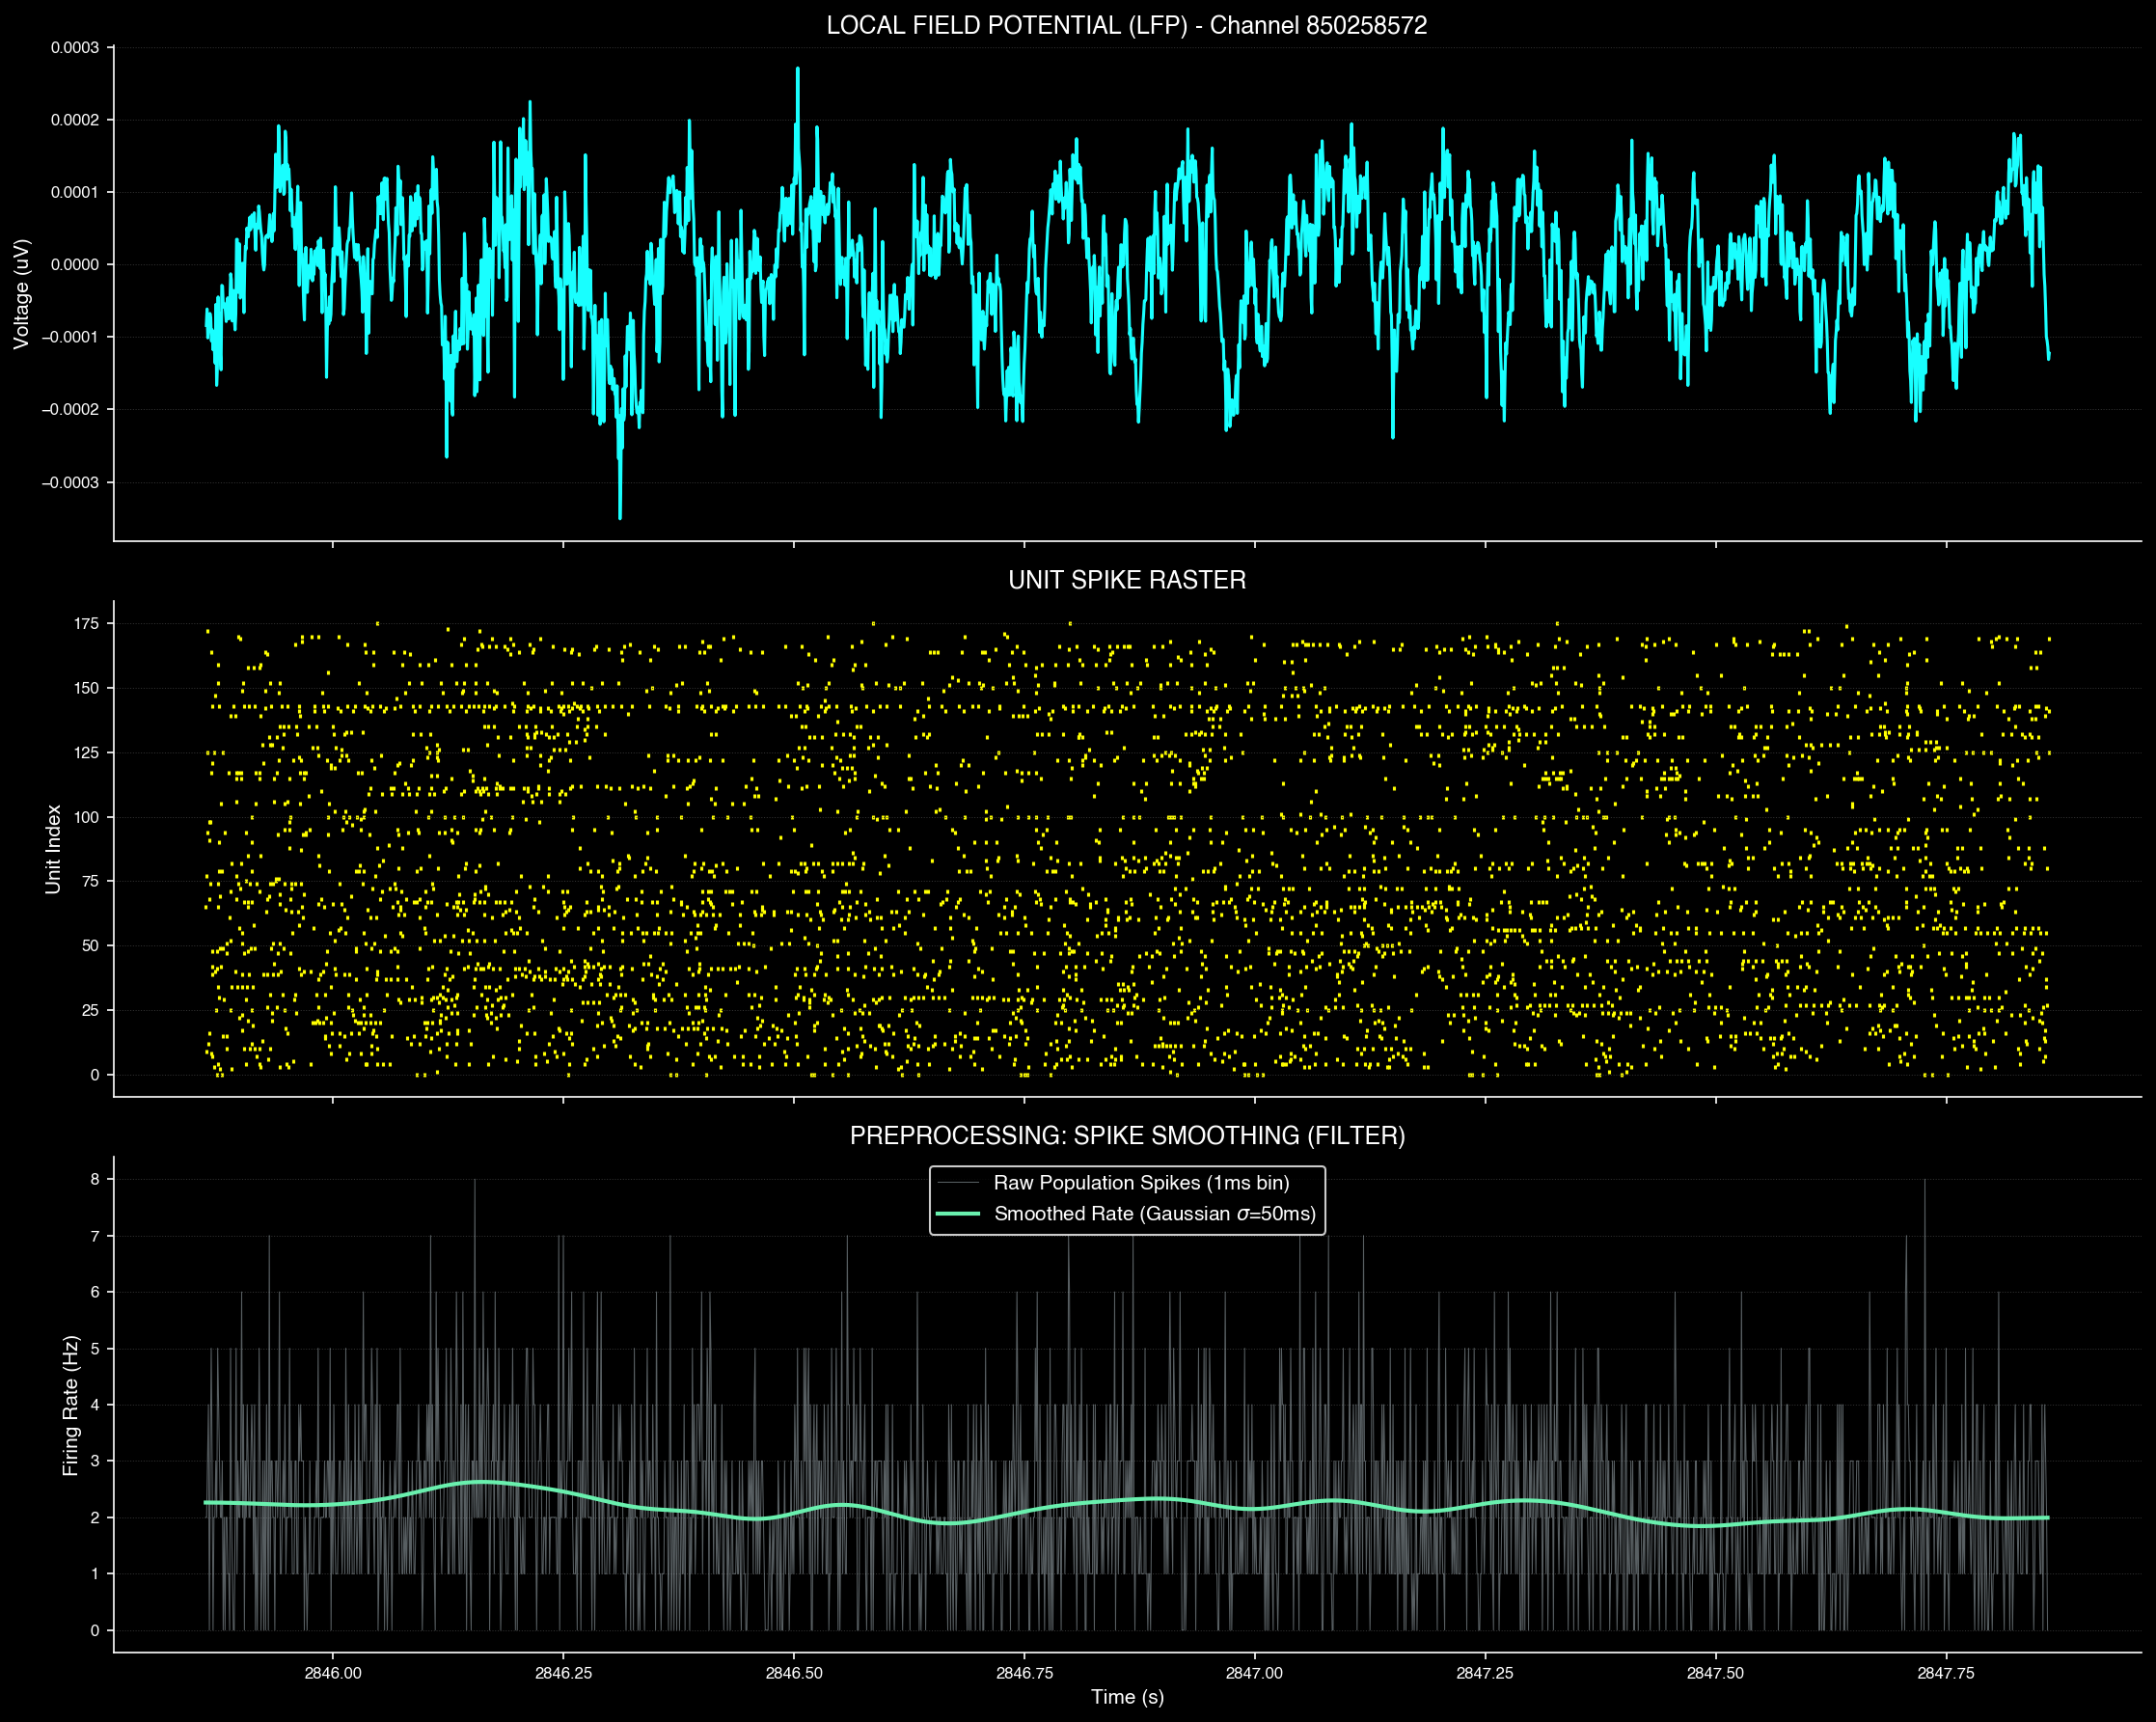
Spike data preprocessing and filtering
The transformation pipeline consists of several key stages:
- LFP Data — Local Field Potential signals capturing raw neural spike trains across hundreds of recording sites
- PCA (Principal Component Analysis) — Reduces high-dimensional neural activity to 3D space while preserving maximum variance, revealing the essential dynamics of population activity
- UMAP — Uniform Manifold Approximation and Projection preserves local neighborhood structure, uncovering the intrinsic manifold geometry of neural representations
- Topological Data Analysis — Persistent Homology quantifies the structure of neural manifolds, revealing their fundamental geometric properties
PCA: Dimensionality Reduction
Principal Component Analysis reveals the essential dynamics of neural population activity by projecting high-dimensional data into 3D space.
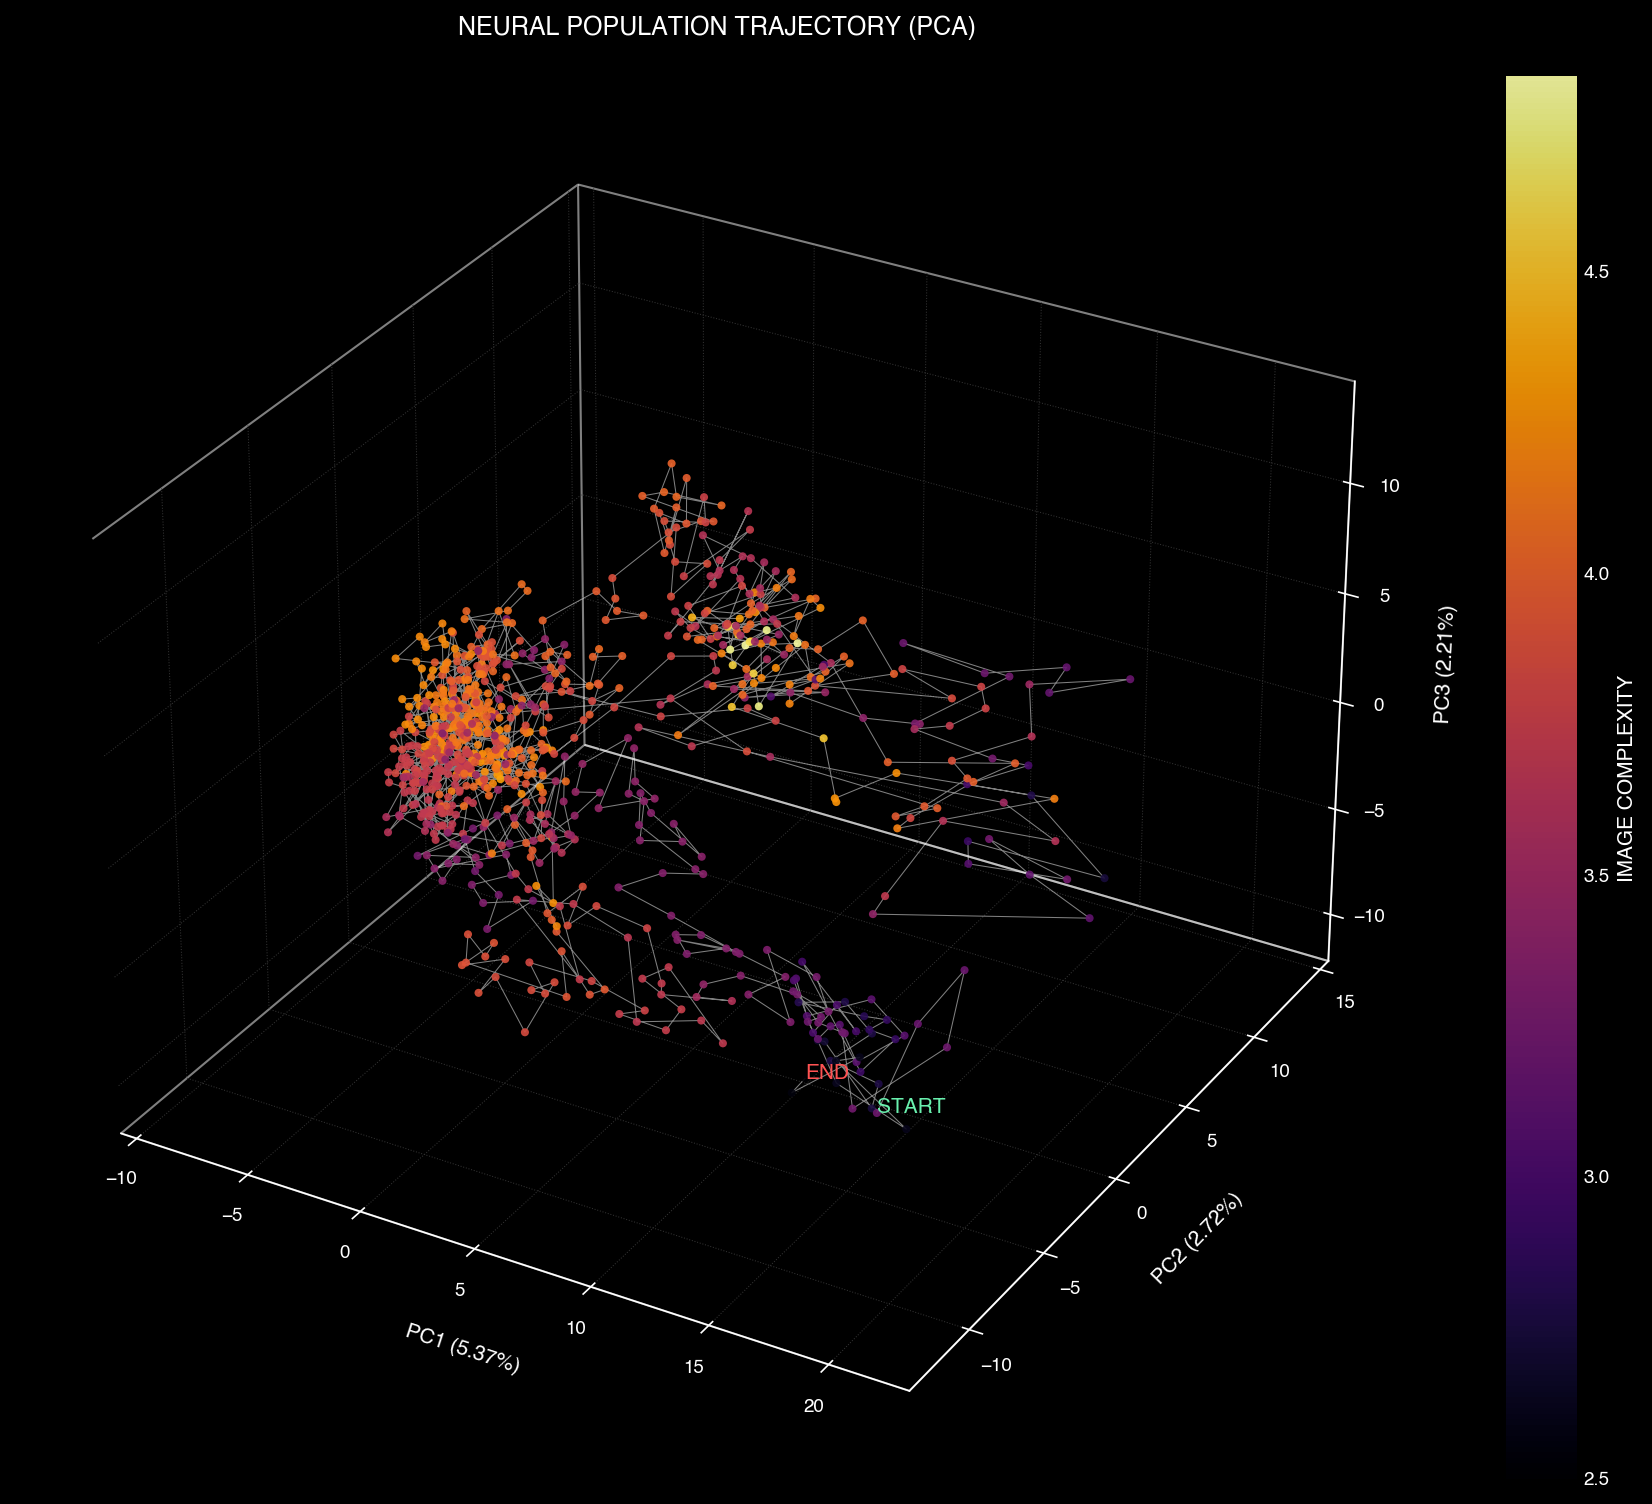
3D PCA projection of neural state space trajectories
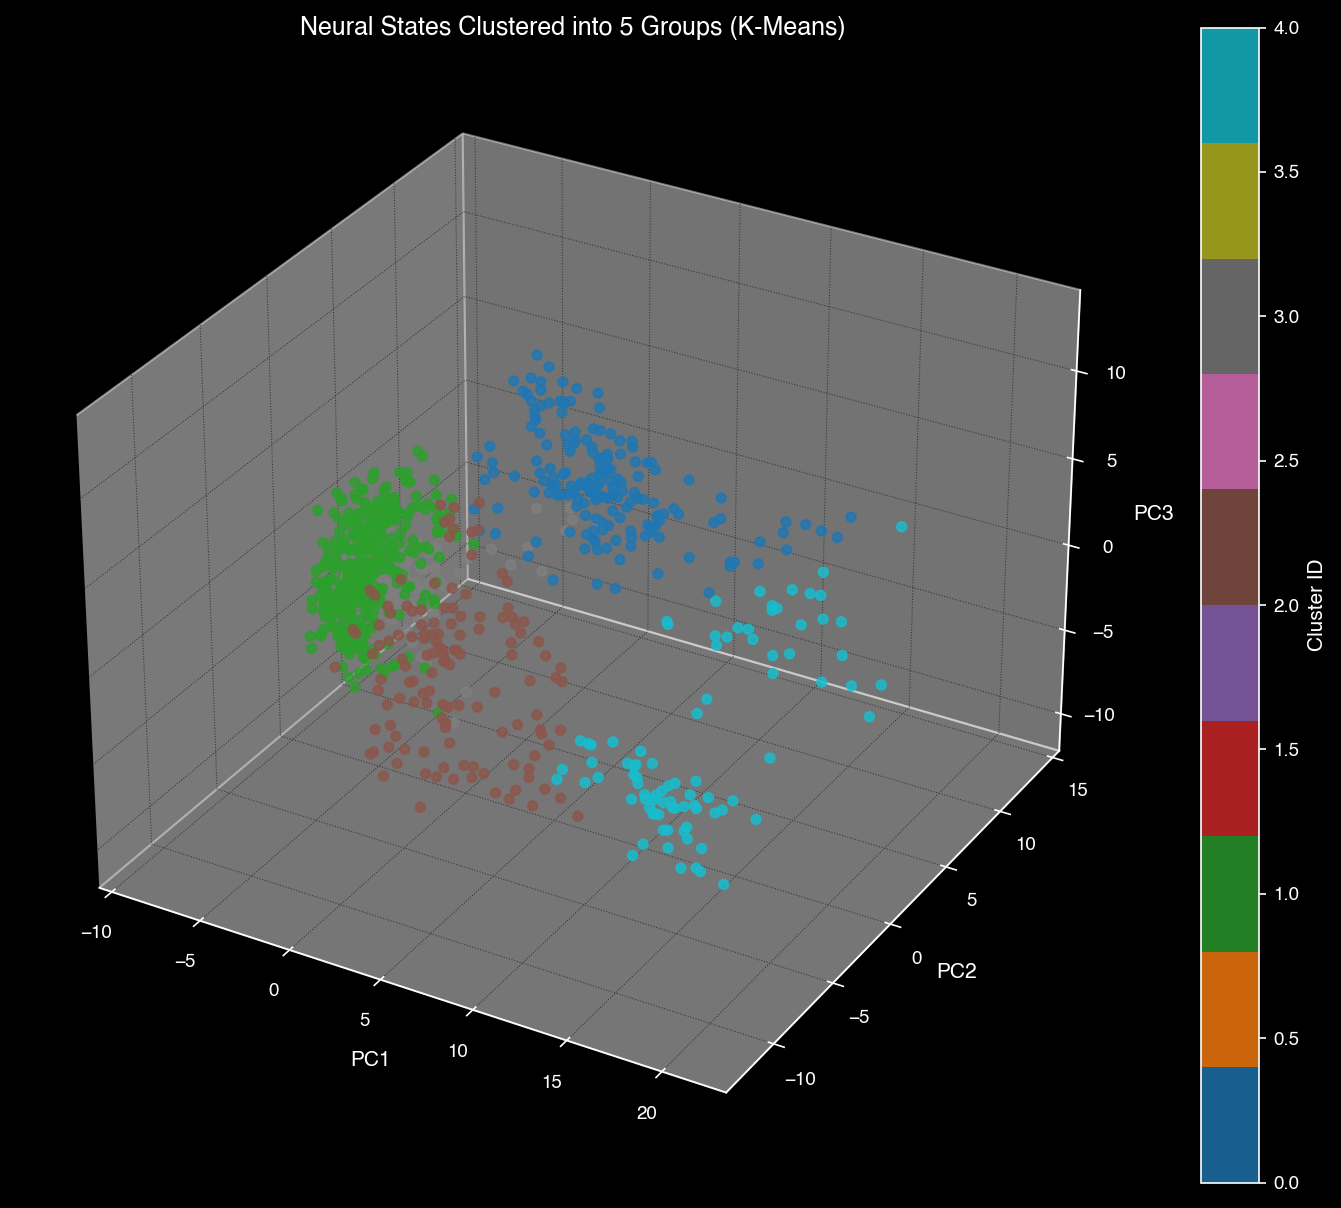
K-means clustering reveals distinct neural states corresponding to visual features
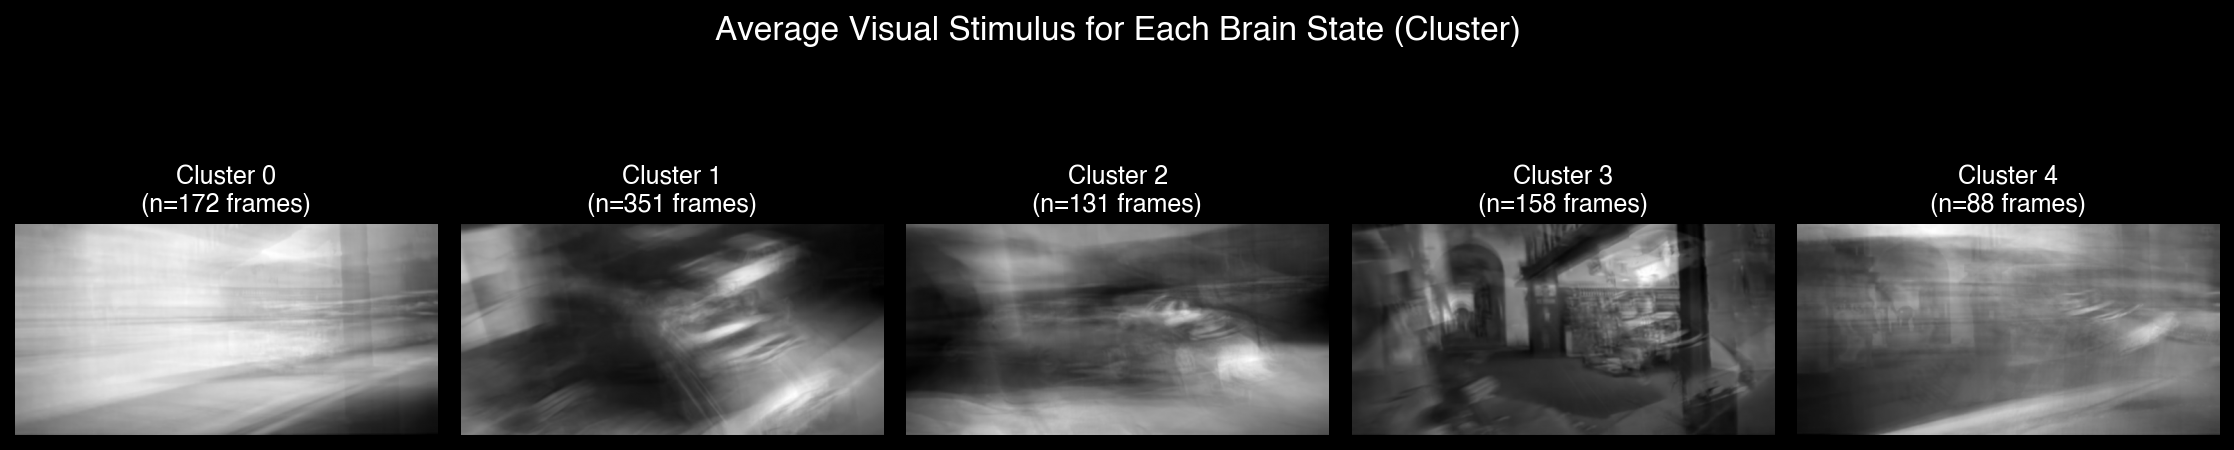
Visual Feature Analysis
Neural manifolds can be recolored by visual properties (luminosity, complexity) to reveal how brain regions encode different aspects of the visual scene.
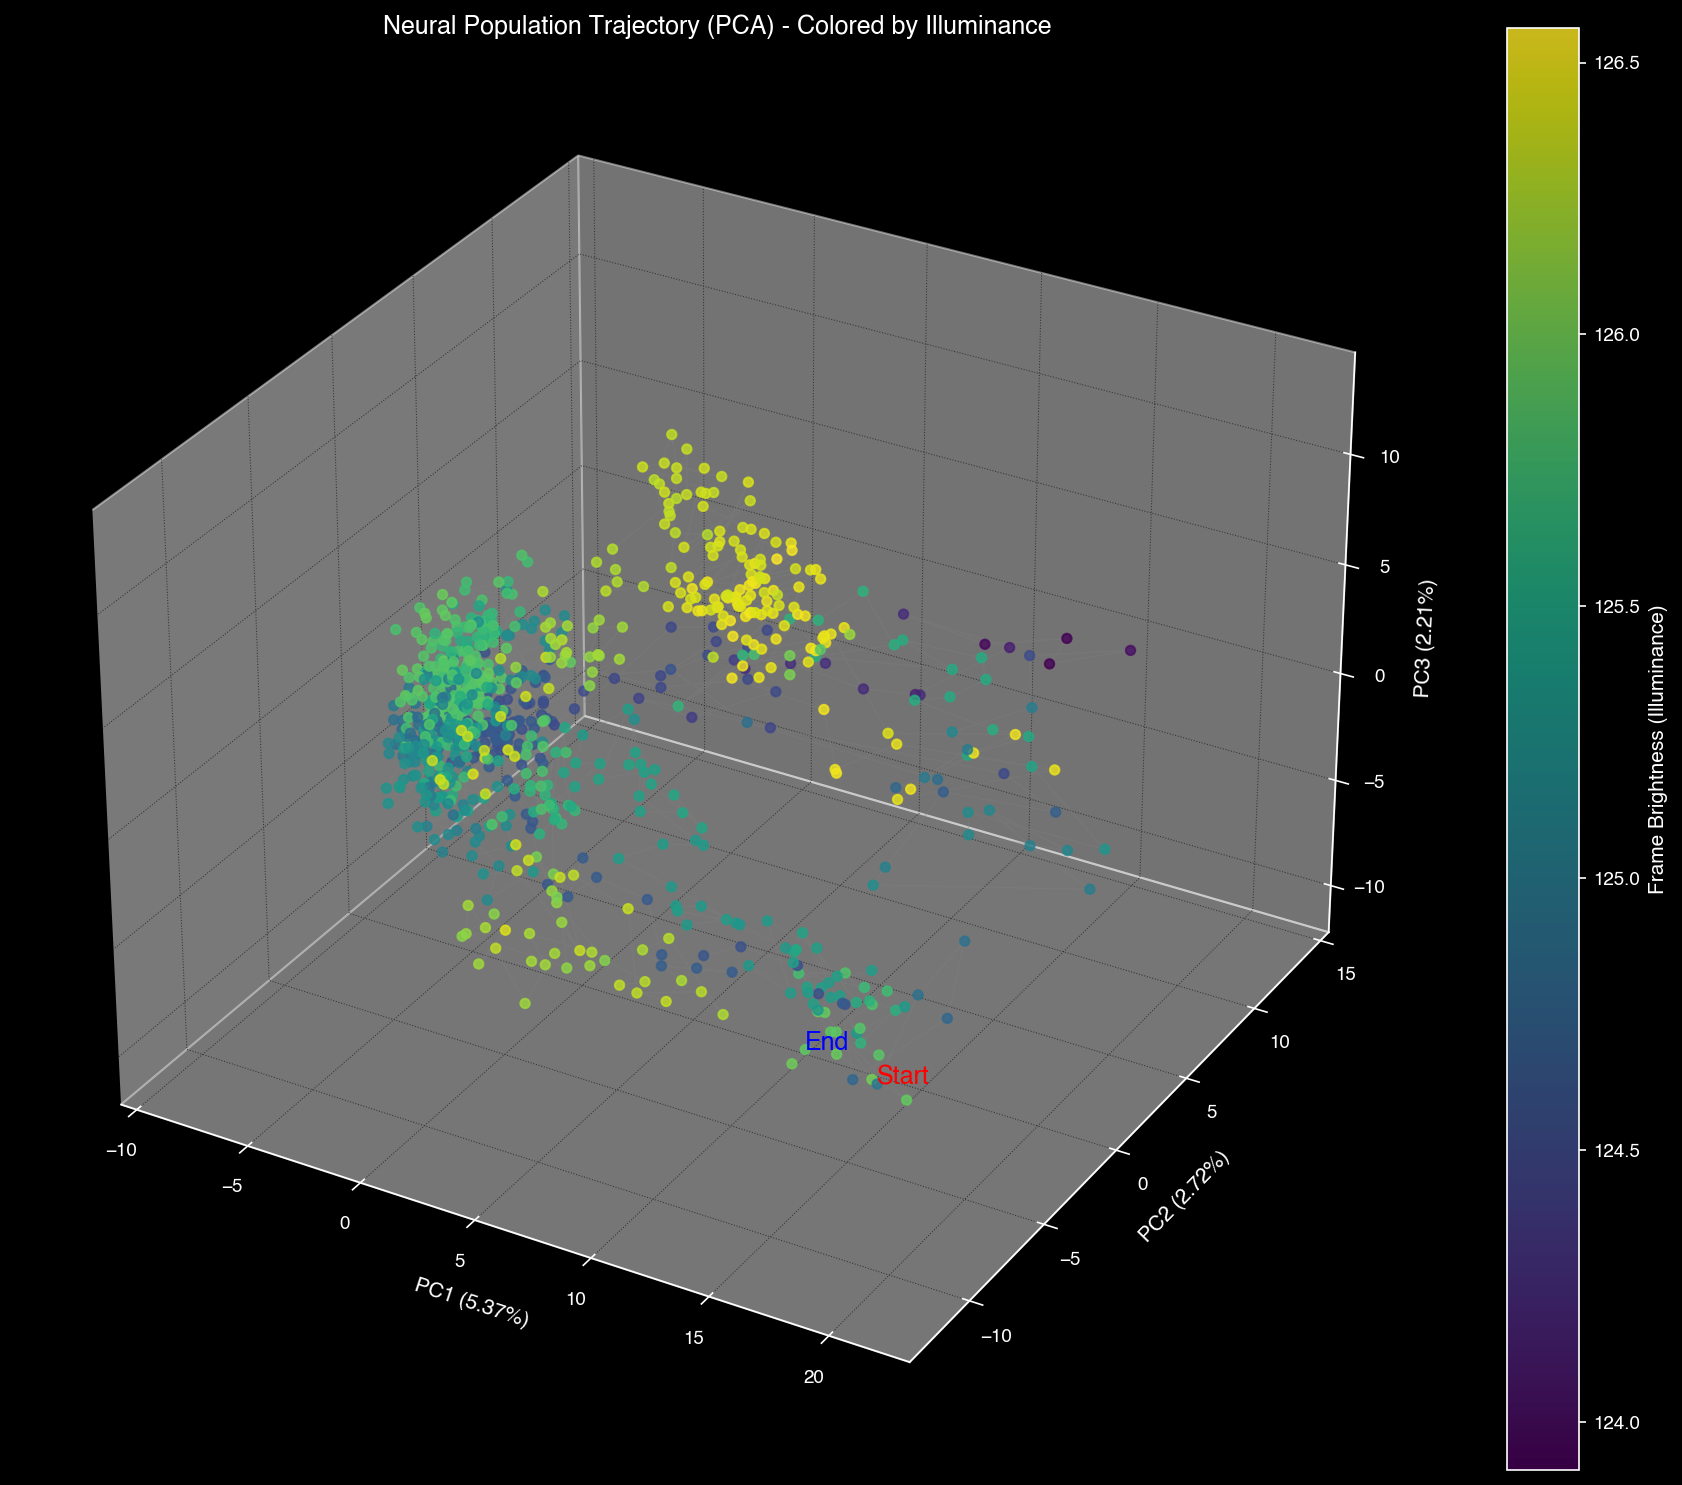
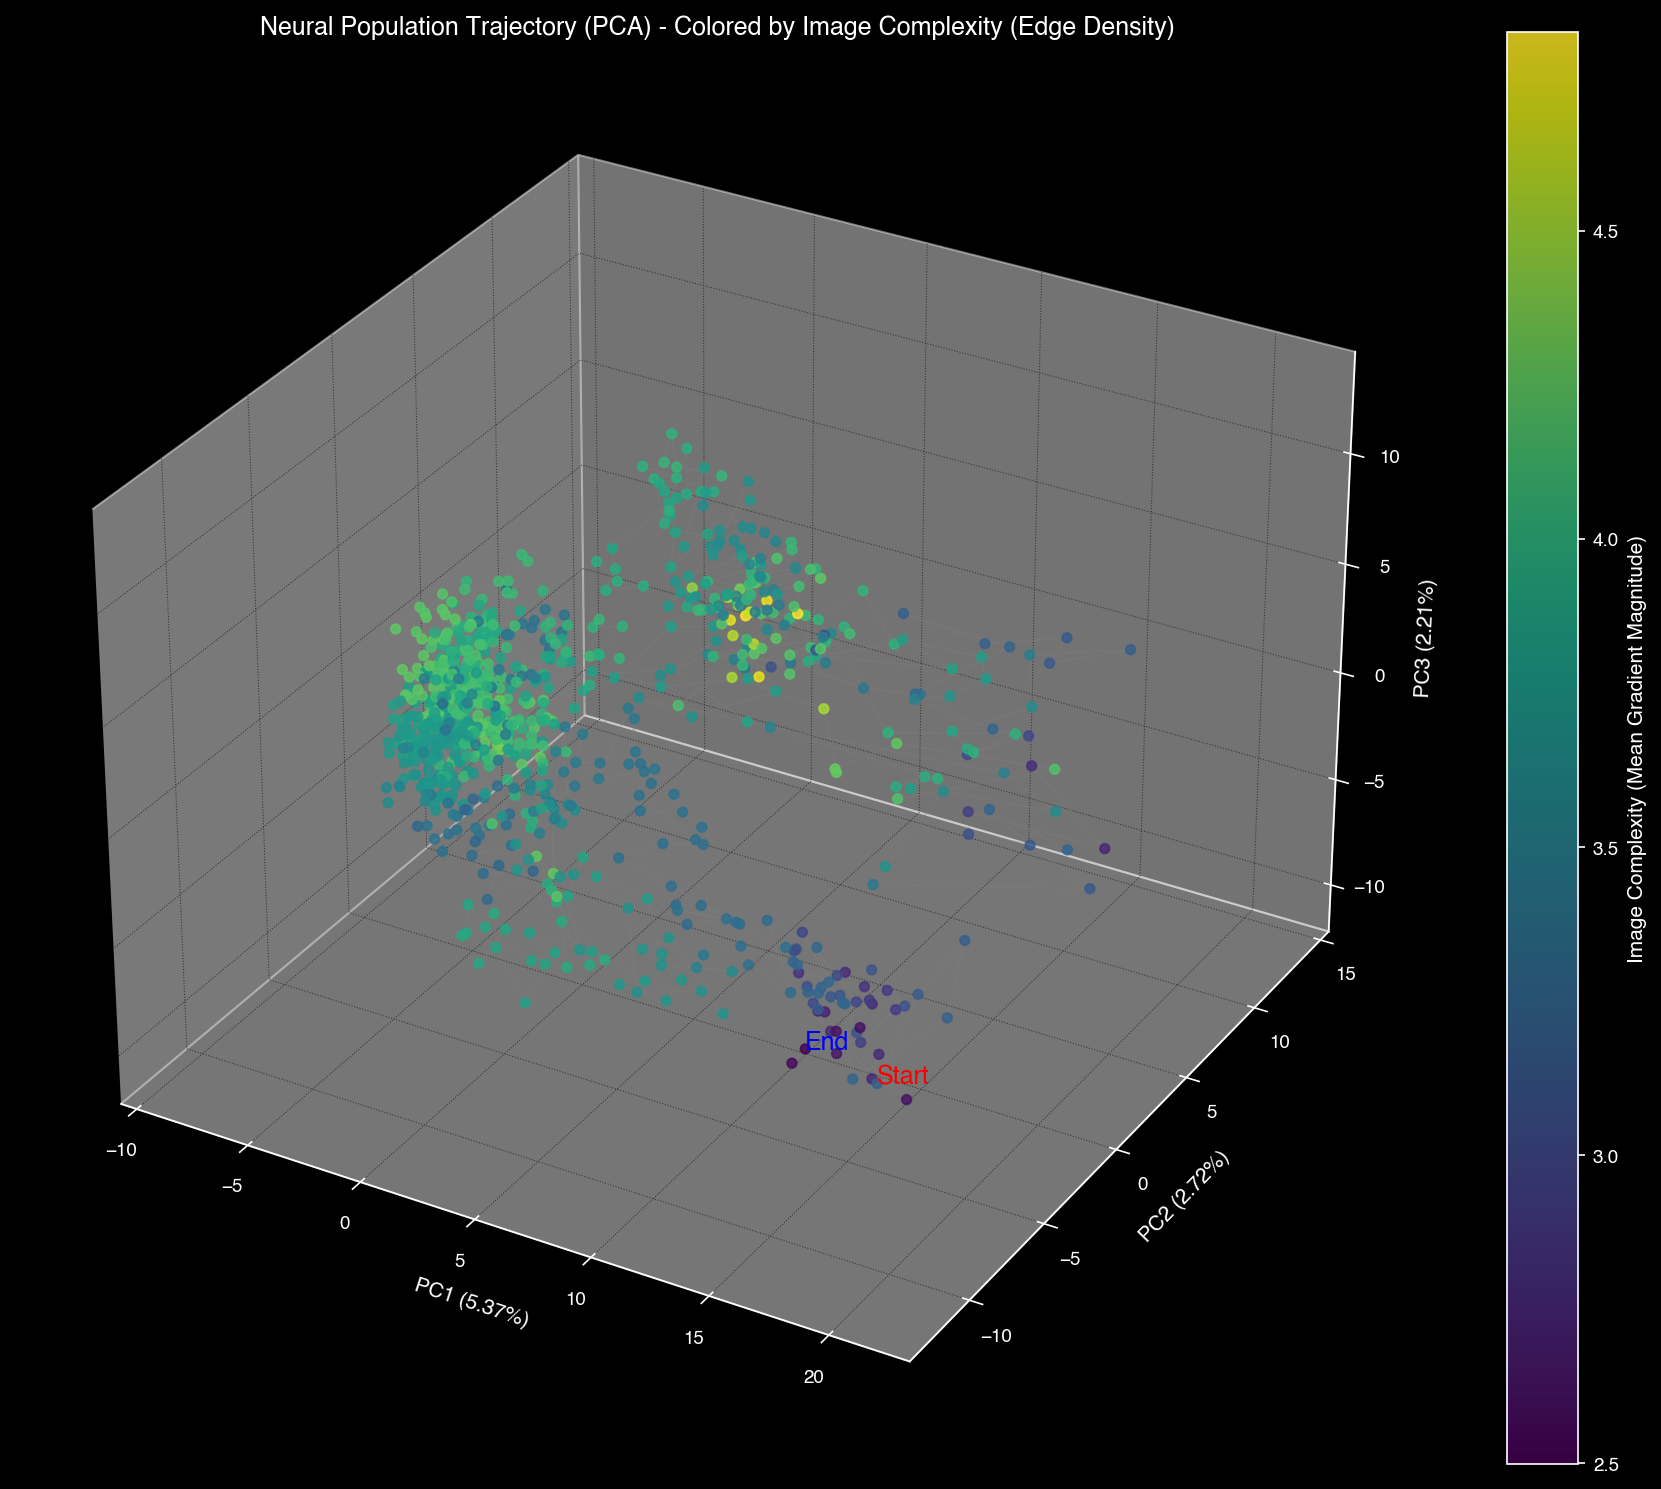
PCA space colored by visual features: luminosity (left) and complexity (right)
Canonical Correlation Analysis
CCA measures the stability and reproducibility of neural representations across different recording sessions, quantifying how consistently brain regions respond to repeated stimuli.
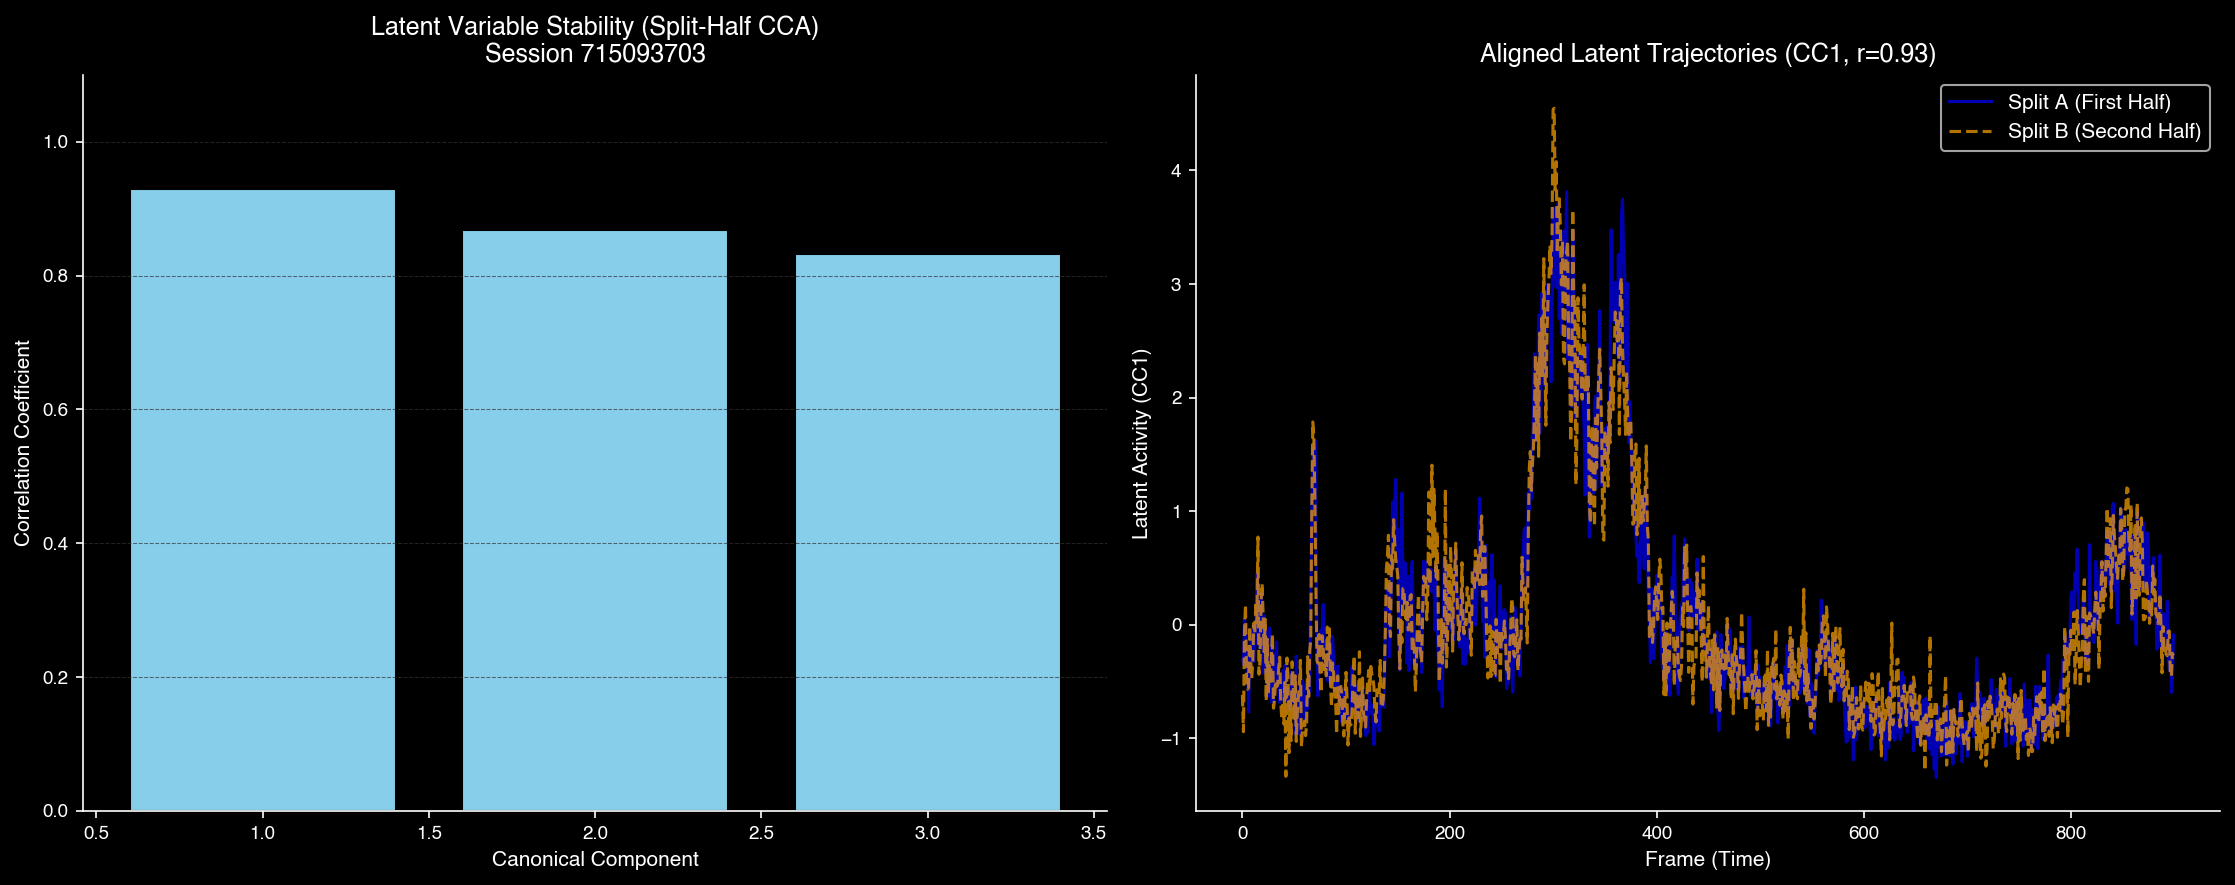
Canonical Correlation Analysis showing high stability across sessions
Topological Data Analysis
Topology is a branch of mathematics that studies properties of space preserved under continuous deformations. In neuroscience, Topological Data Analysis (TDA) provides a rigorous framework to quantify the geometric structure of high-dimensional neural representations.
Persistent Homology
What is Persistent Homology? Imagine gradually increasing the radius of balls around each data point in your neural manifold. As the radius grows, nearby points connect to form clusters, some clusters form loops or holes, and in higher dimensions, voids emerge. Persistent Homology tracks when each topological feature is "born" and when it "dies," revealing which structures are fundamental and which are noise.
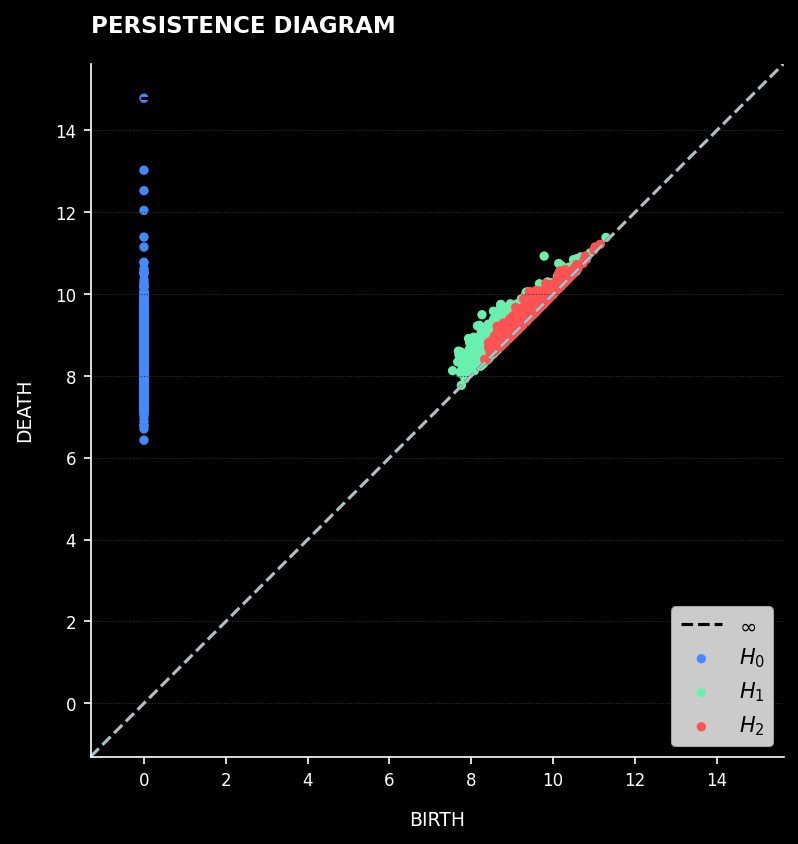
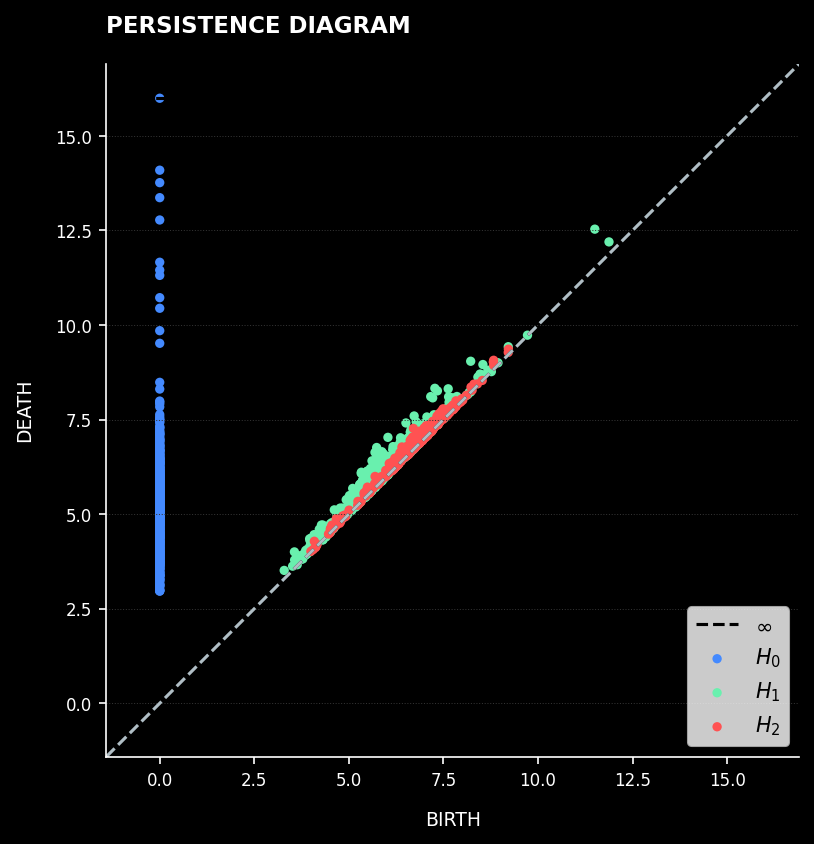
Persistence Diagram: Each point represents a topological feature plotted by birth and death times
Homological Features:
- H₀ (Connected Components) — Individual clusters that merge as scale increases. Long-lived H₀ features indicate stable, distinct clusters in the data.
- H₁ (Loops/Cycles) — Circular structures or holes in the data. Their presence reveals non-trivial topological structure beyond simple branching.
- H₂ (Voids/Cavities) — Three-dimensional voids. Their detection indicates complex higher-dimensional geometric organization.
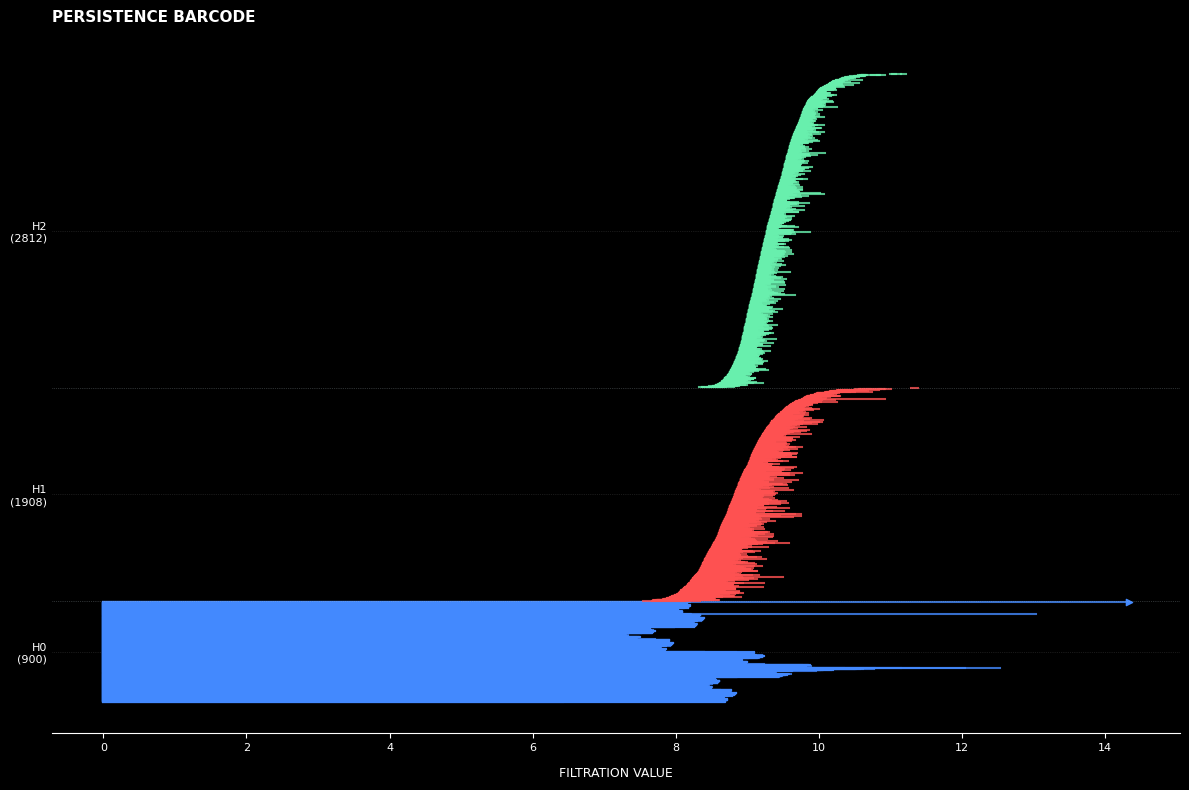
Barcode Analysis: Each horizontal bar represents the lifespan of a topological feature
Neural Manifolds
Neural population activity exists in extremely high-dimensional space. Through dimensionality reduction (PCA, UMAP) and topological analysis, we discover that this activity lies on low-dimensional manifolds—geometric structures embedded in high-dimensional space.
Key Findings: Persistent Homology reveals that neural manifolds across visual brain regions exhibit predominantly one-dimensional tree-like structures. This means the seemingly complex neural dynamics follow hierarchical branching pathways through state space.
Persistent Homology analysis reveals tree-like manifold structure
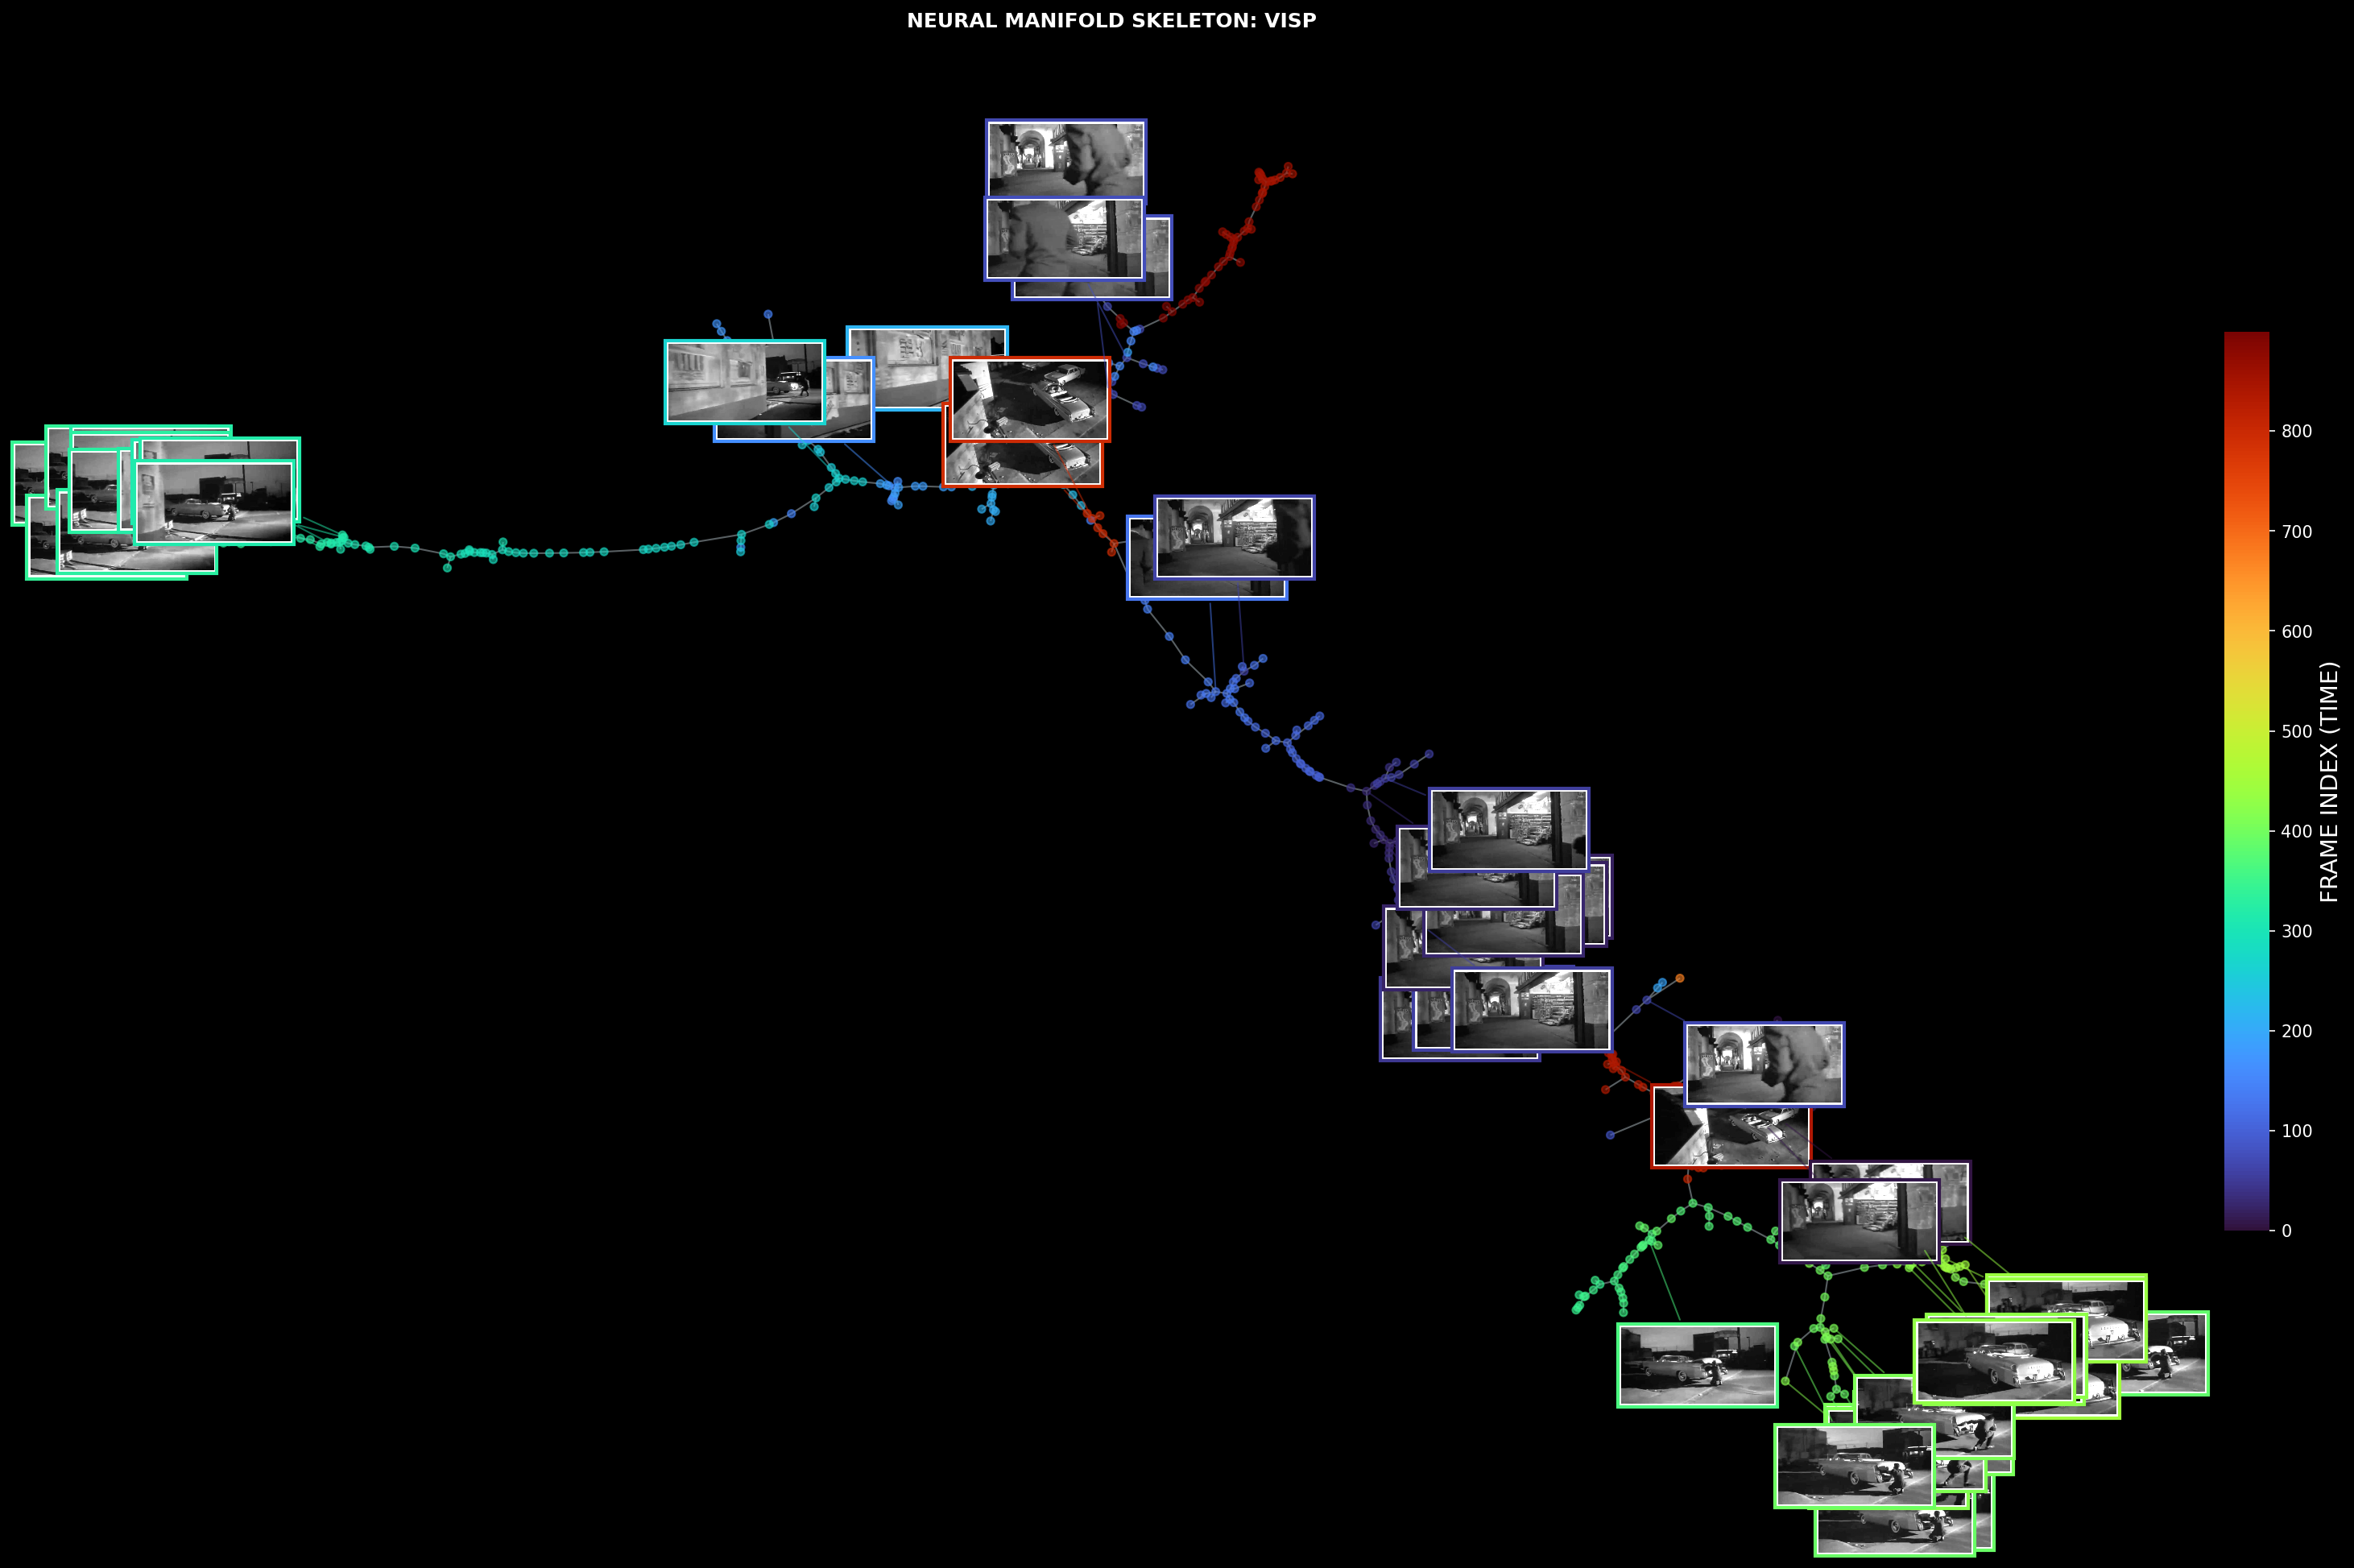
From Manifold to Tree Structure
The geometric form obtained from Persistent Homology is unfolded into two-dimensional tree representations. This transformation preserves topological relationships while making hierarchical branching visible:
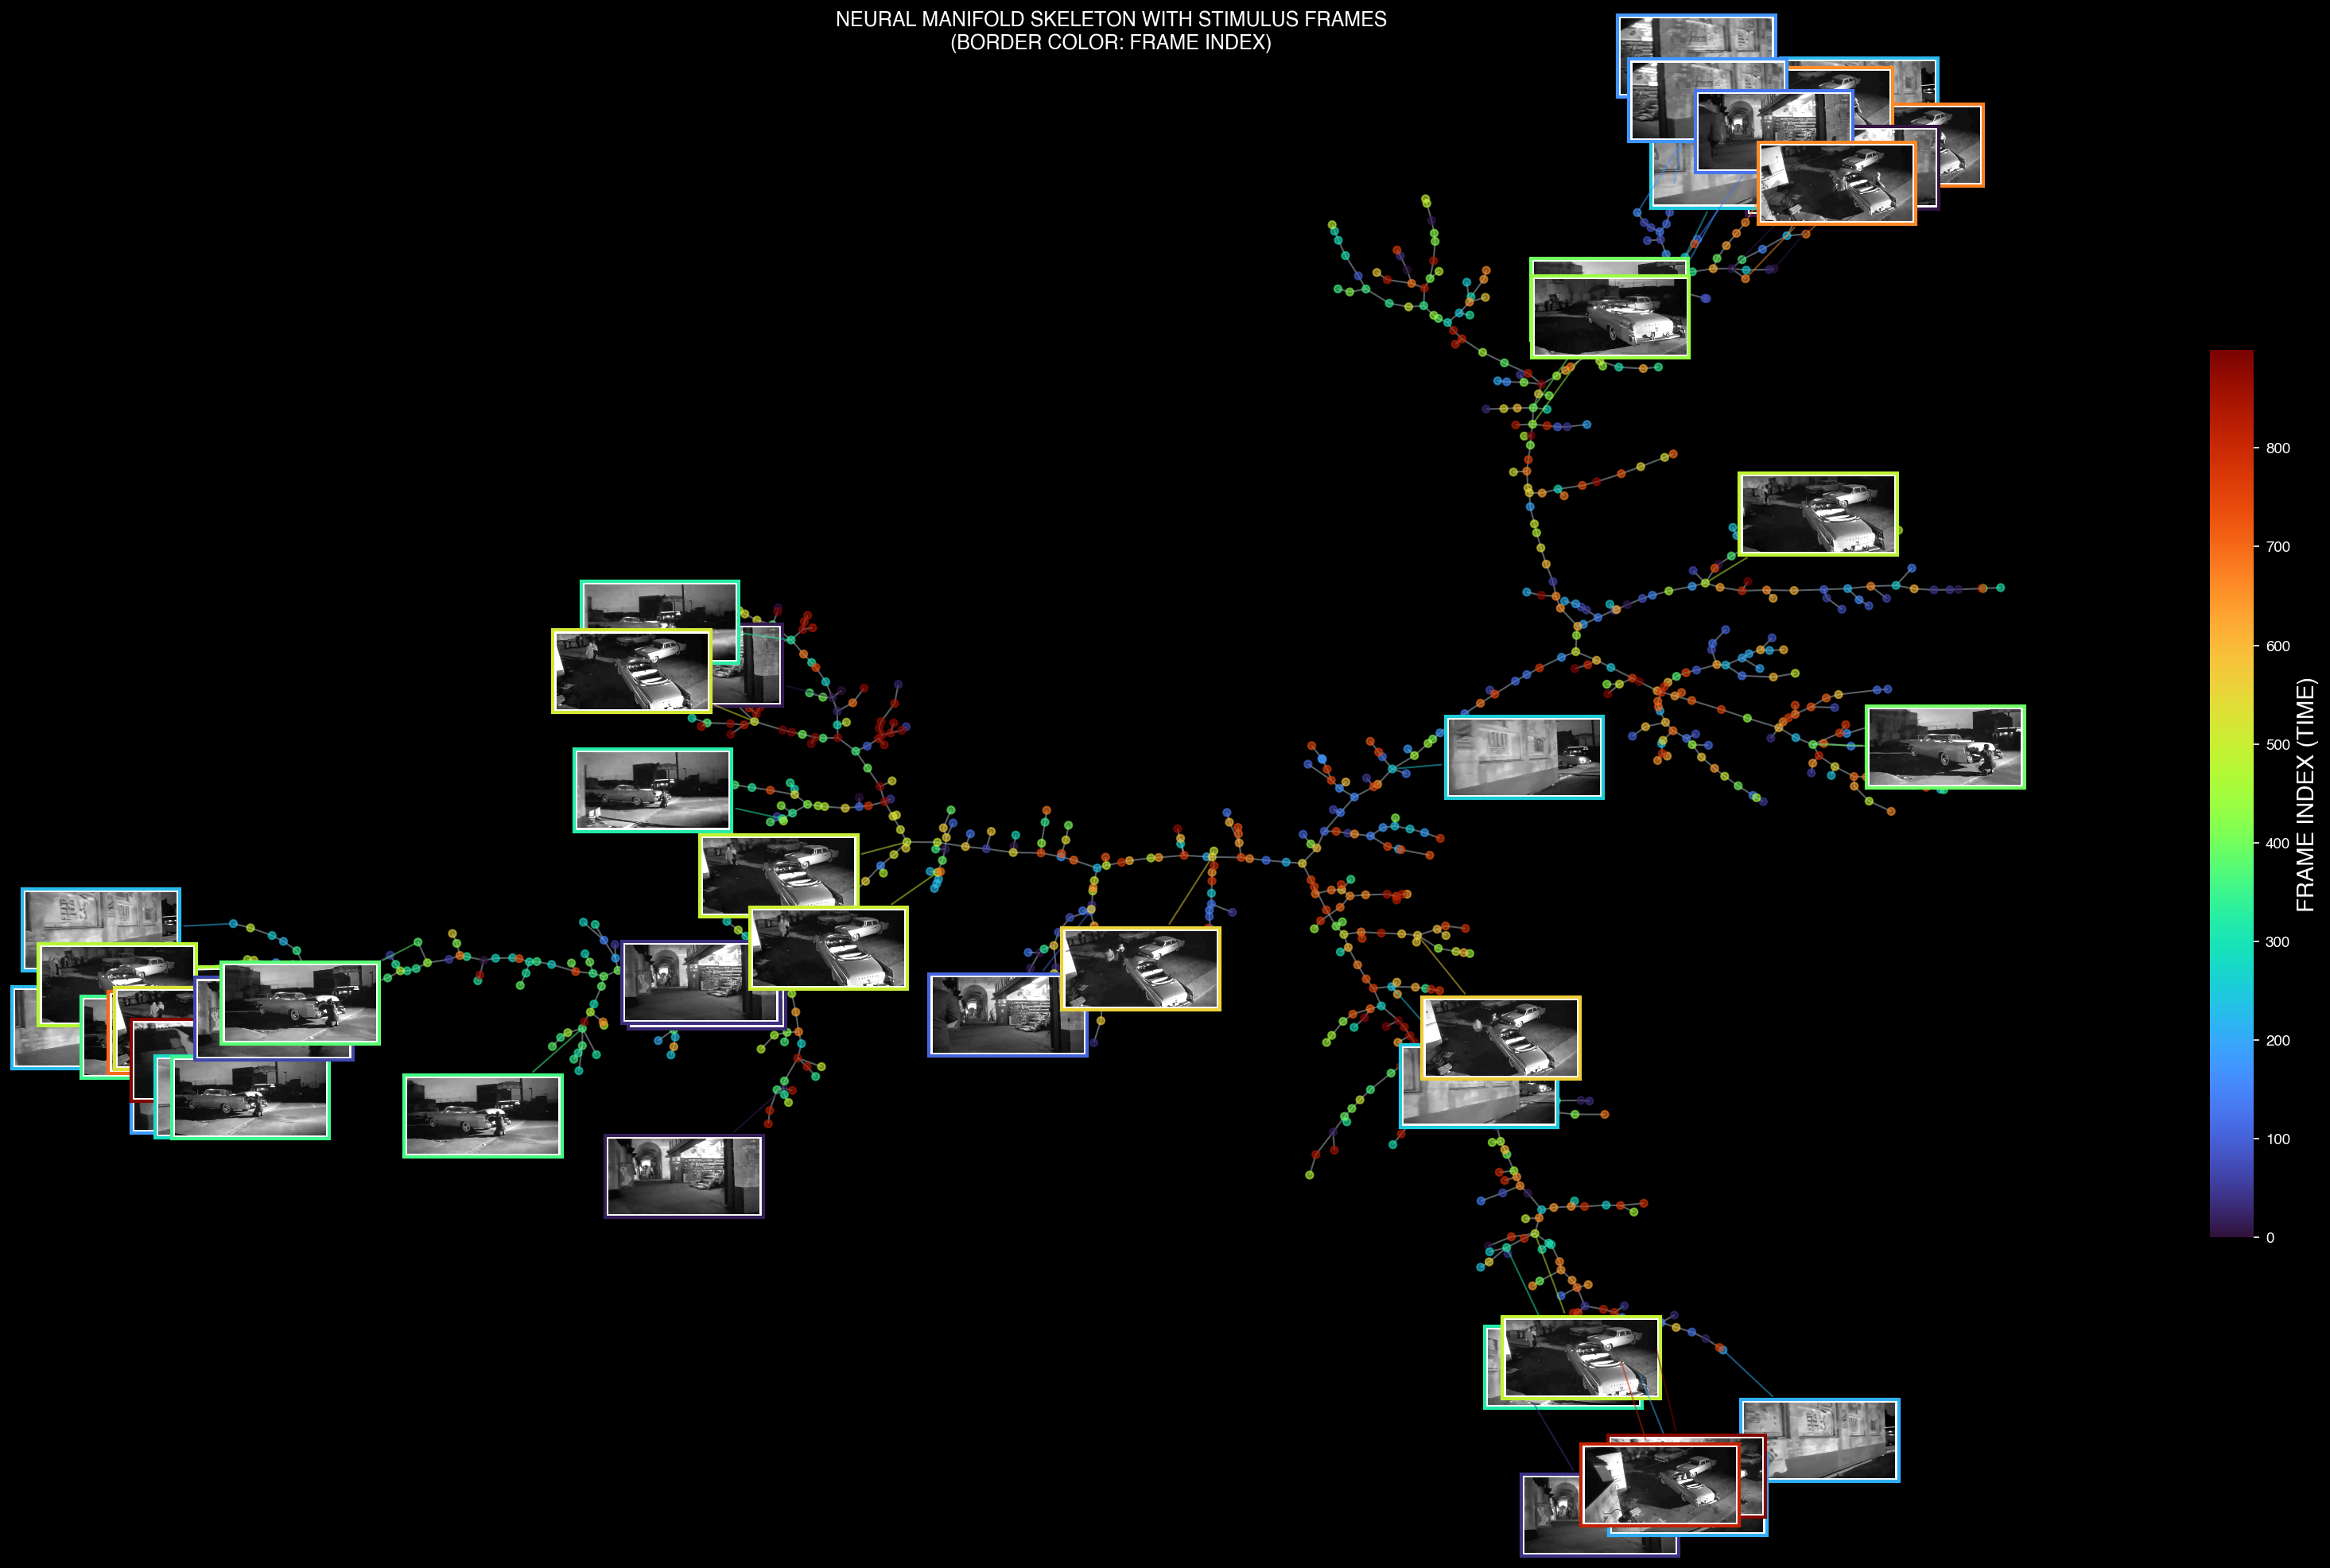
Neural manifold skeleton overlaid with corresponding stimulus frames
- Nodes — Represent stable neural population states corresponding to specific visual features or computational stages
- Branches — Show pathways of neural trajectories as populations transition between different encoding states
- Branch Points — Indicate decision points where neural dynamics diverge based on stimulus properties or internal processing
Regional Brain Manifolds
Each brain region exhibits its own unique topological structure, reflecting specialized computational roles in visual processing.
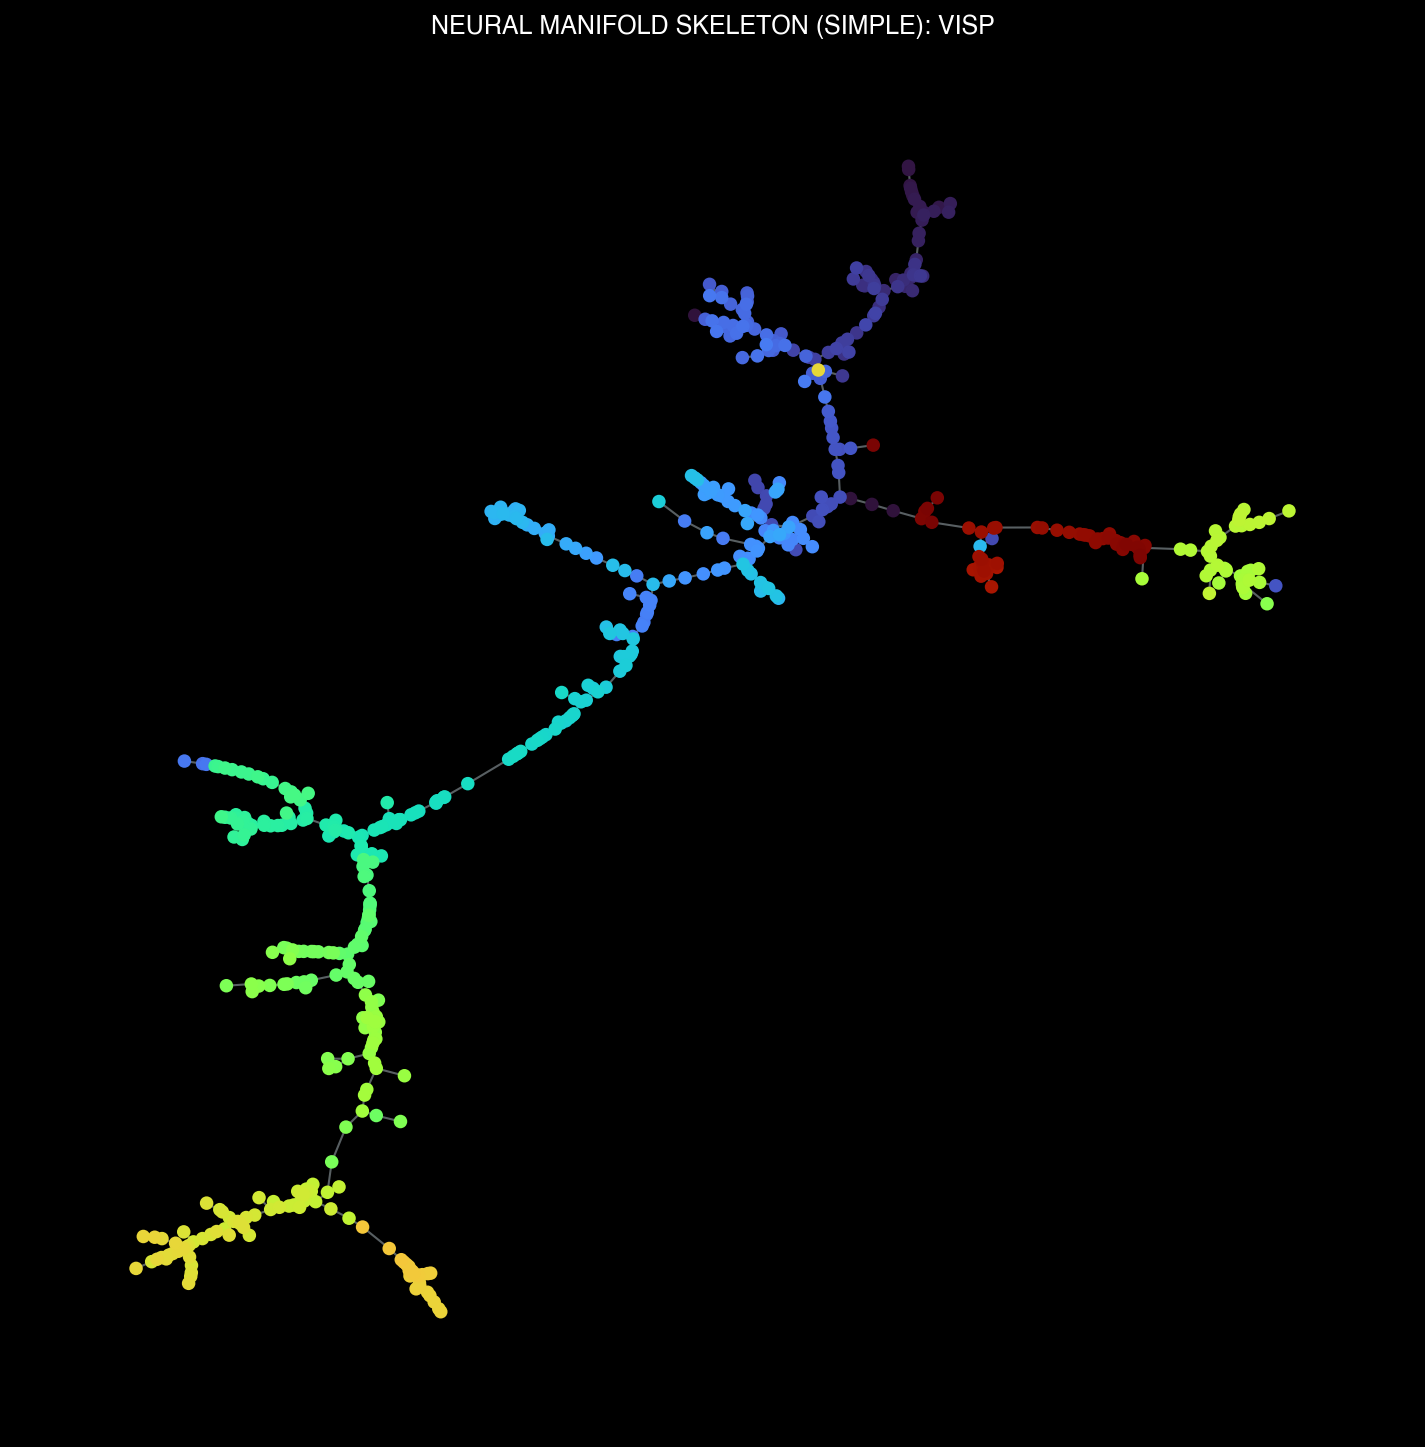
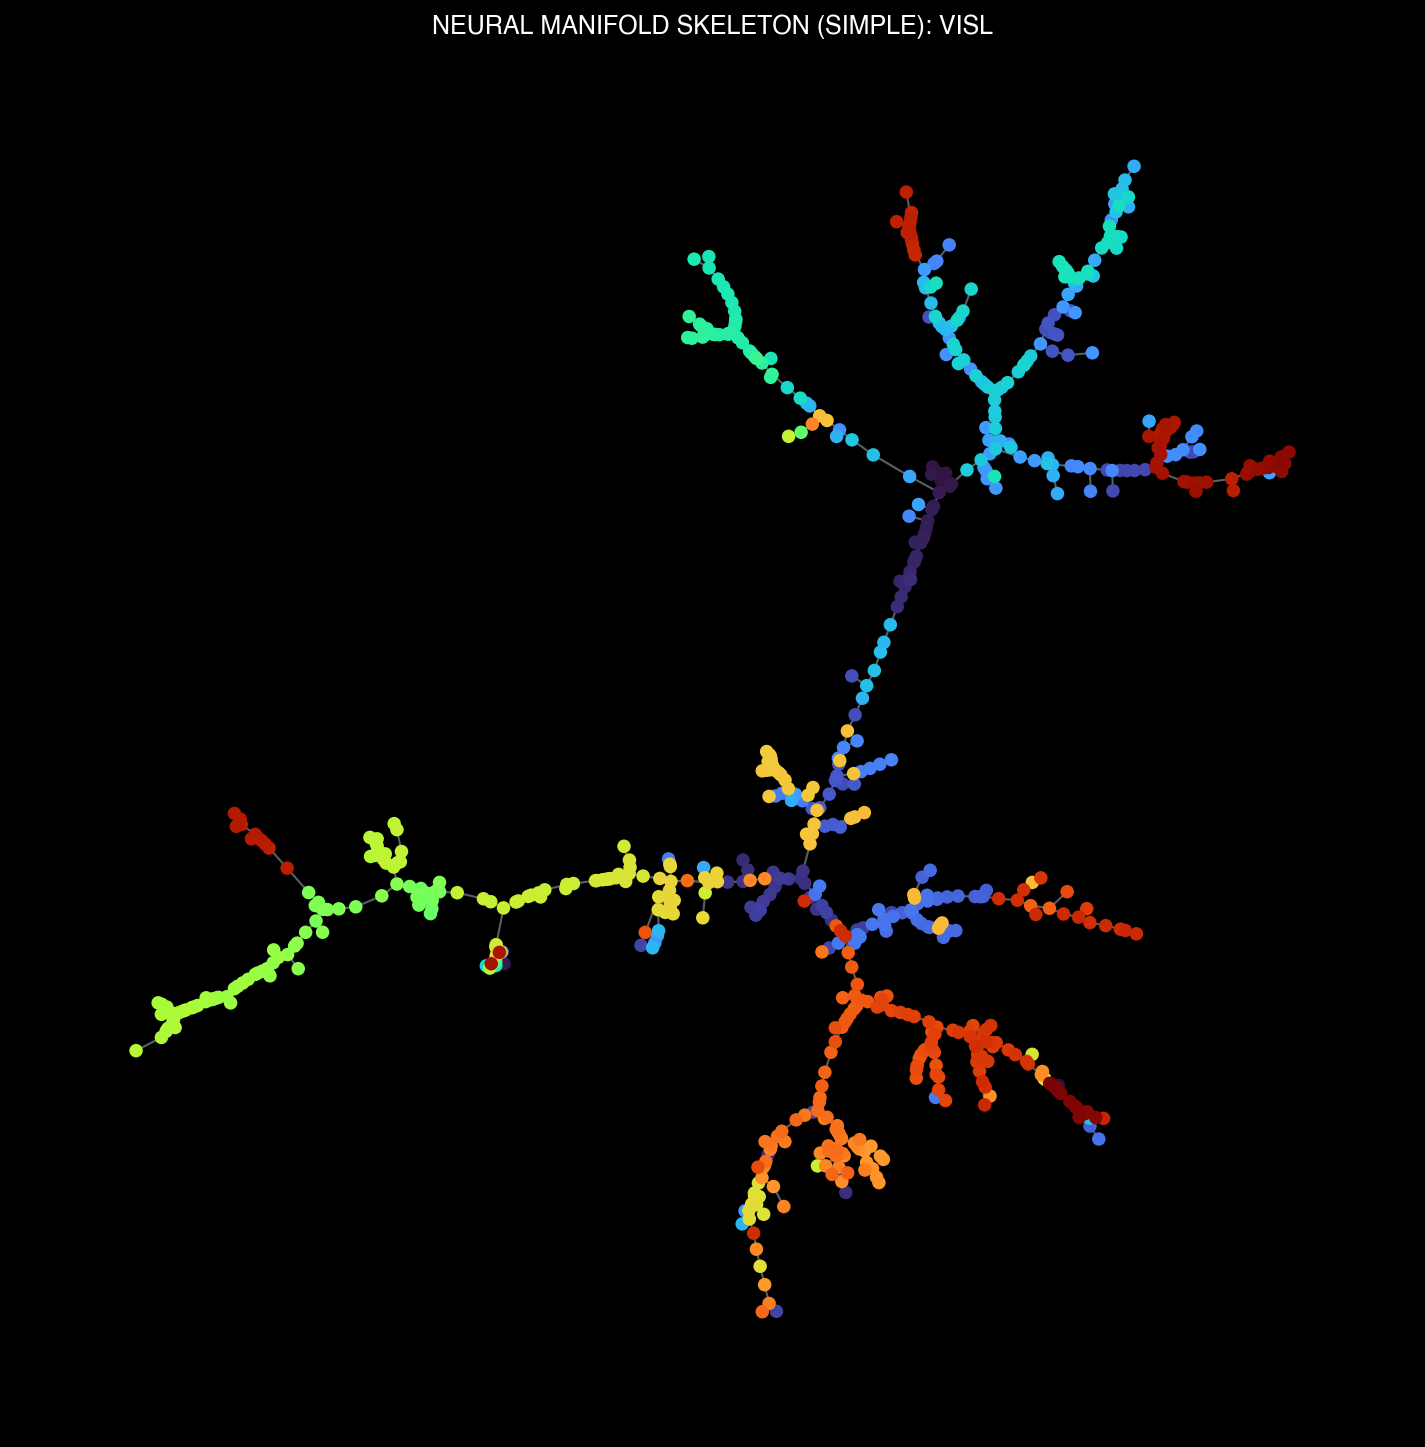
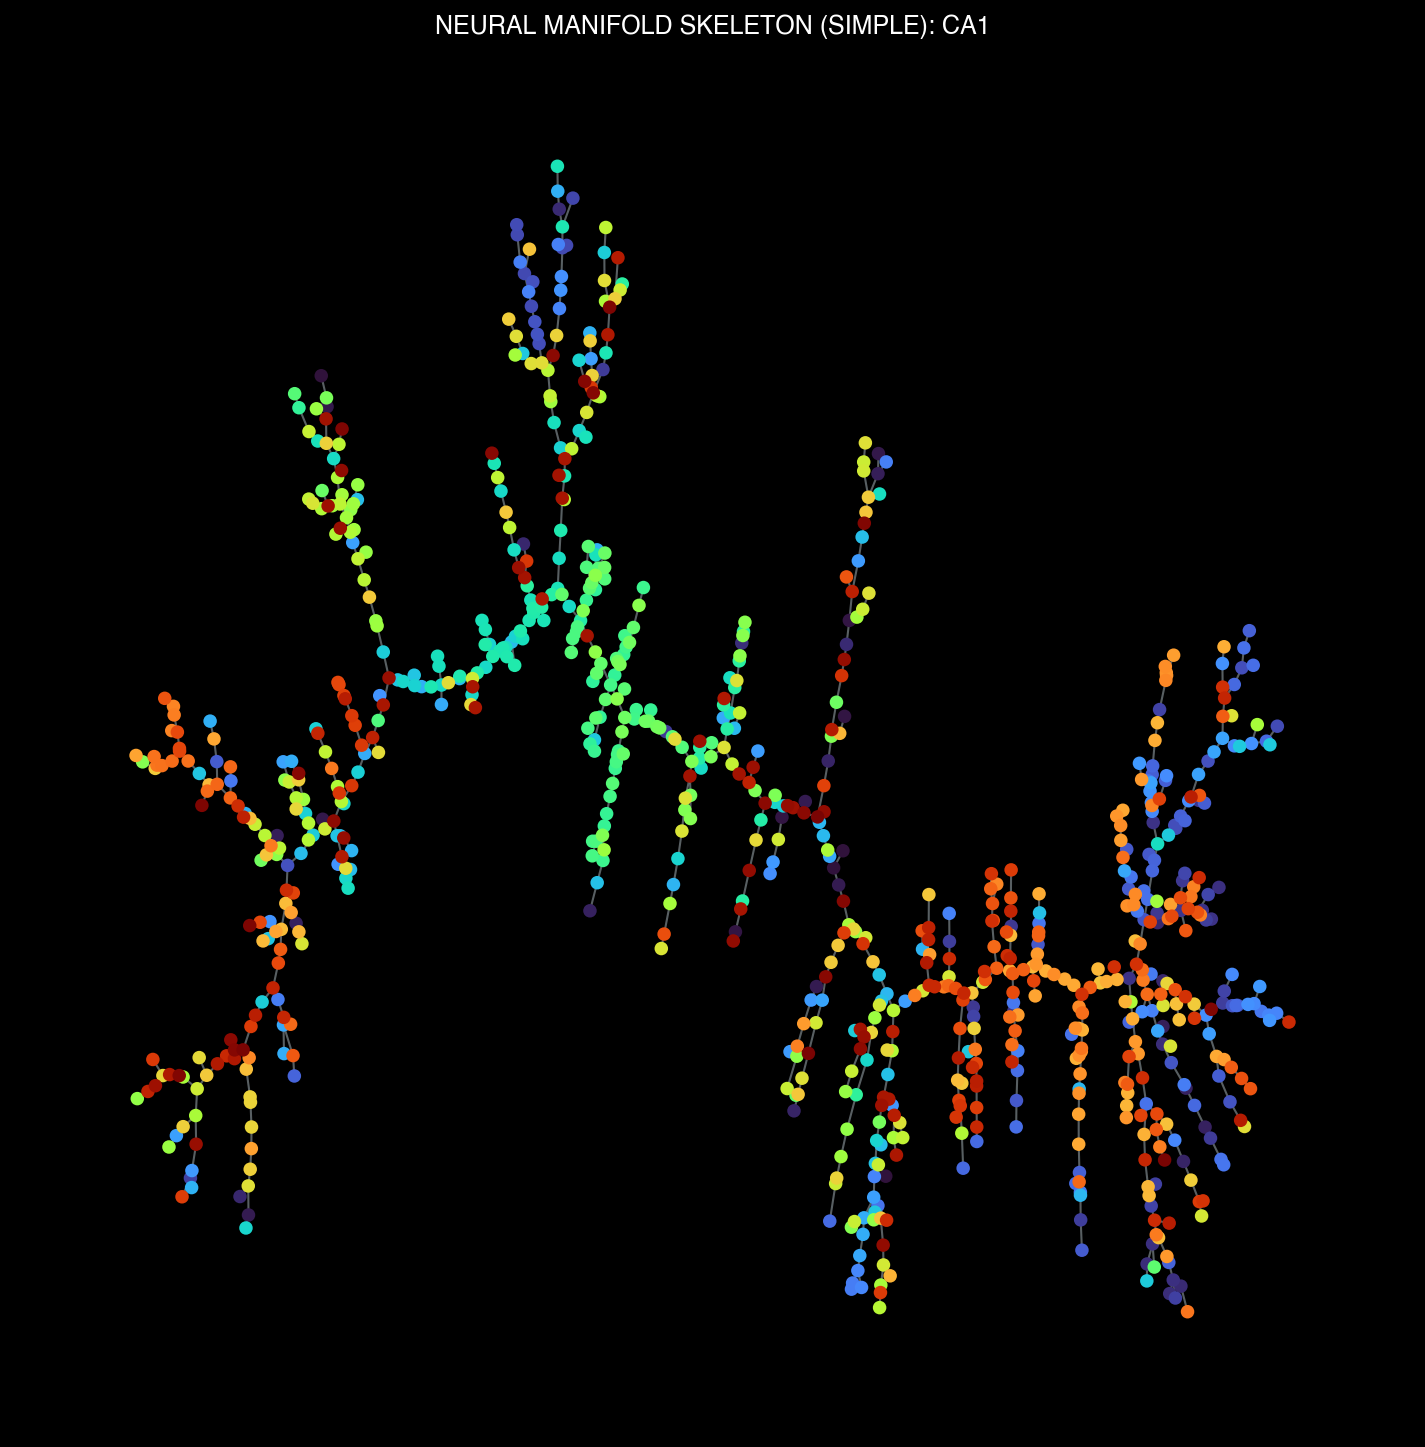
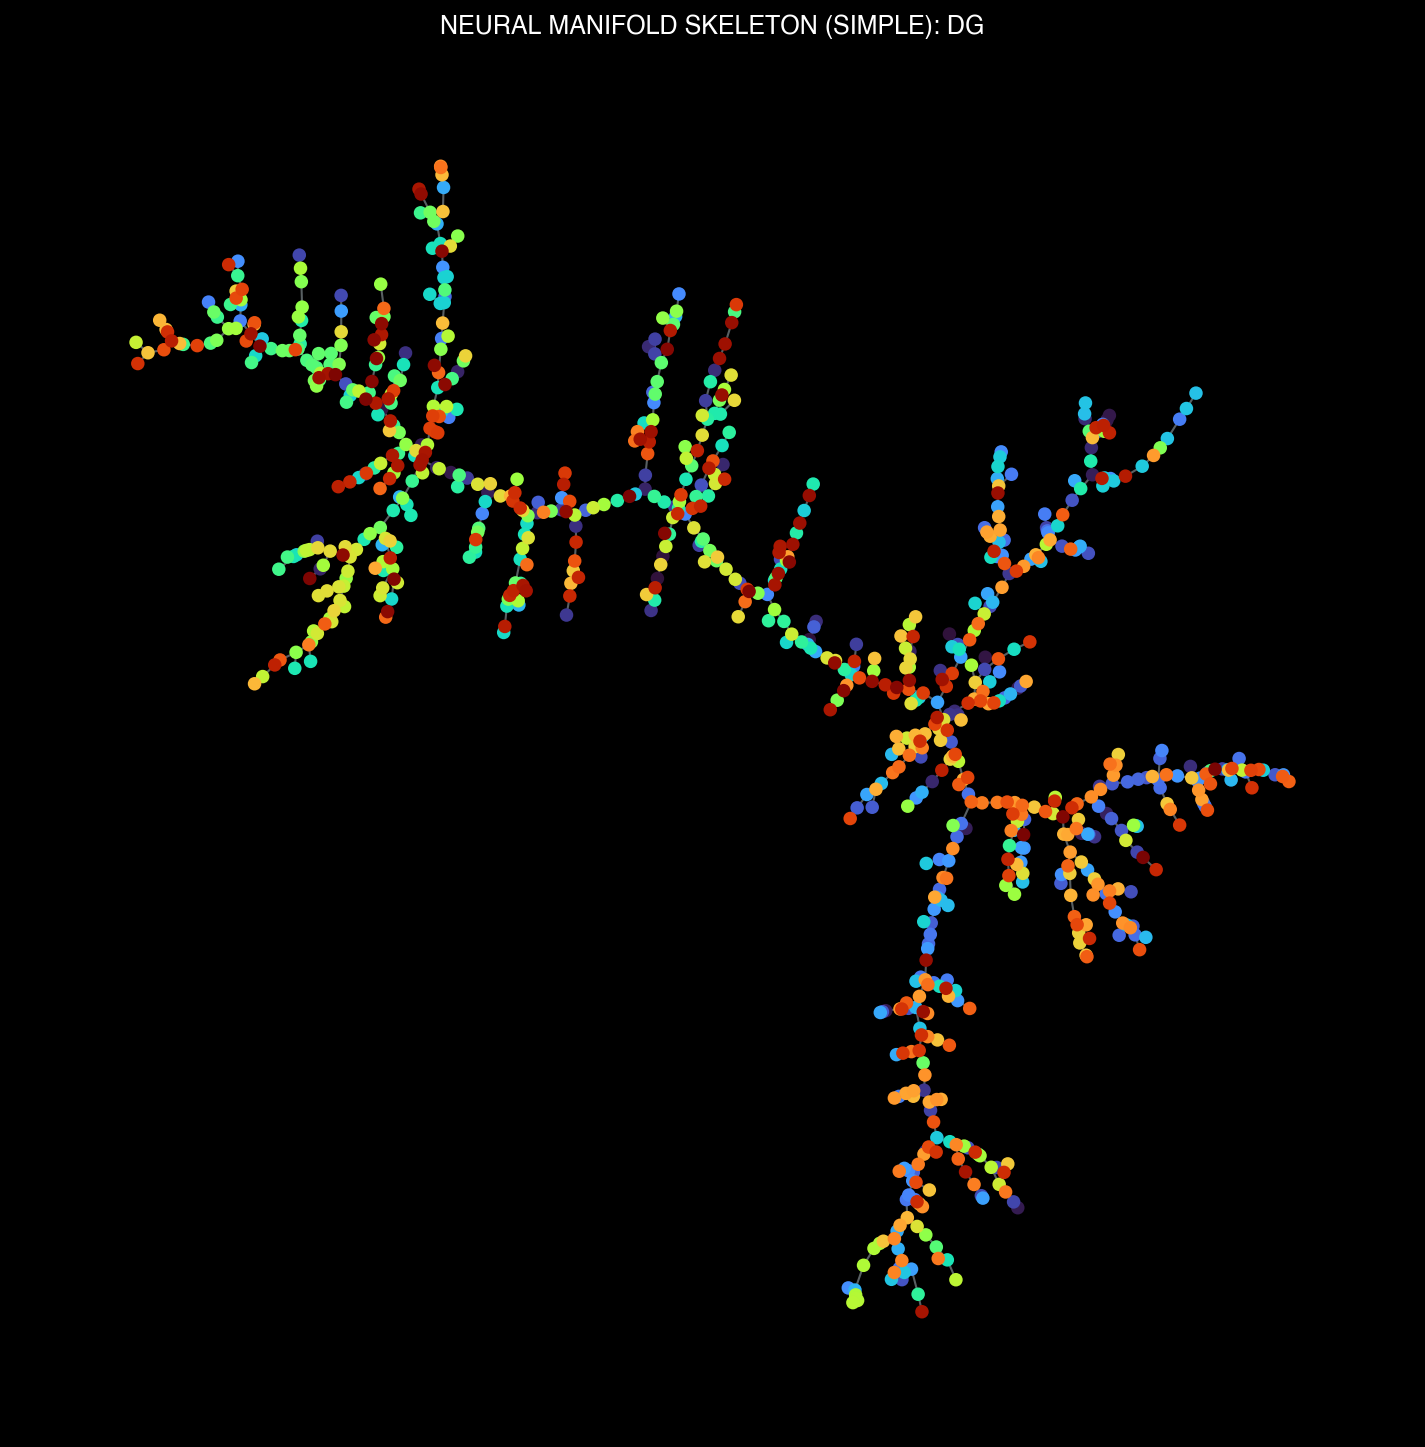
Manifold skeletons across different brain regions: VISp, VISl, CA1, DG
3D Manifold Visualizations
Full 3D manifold structures reveal the complex branching topology of neural state spaces.
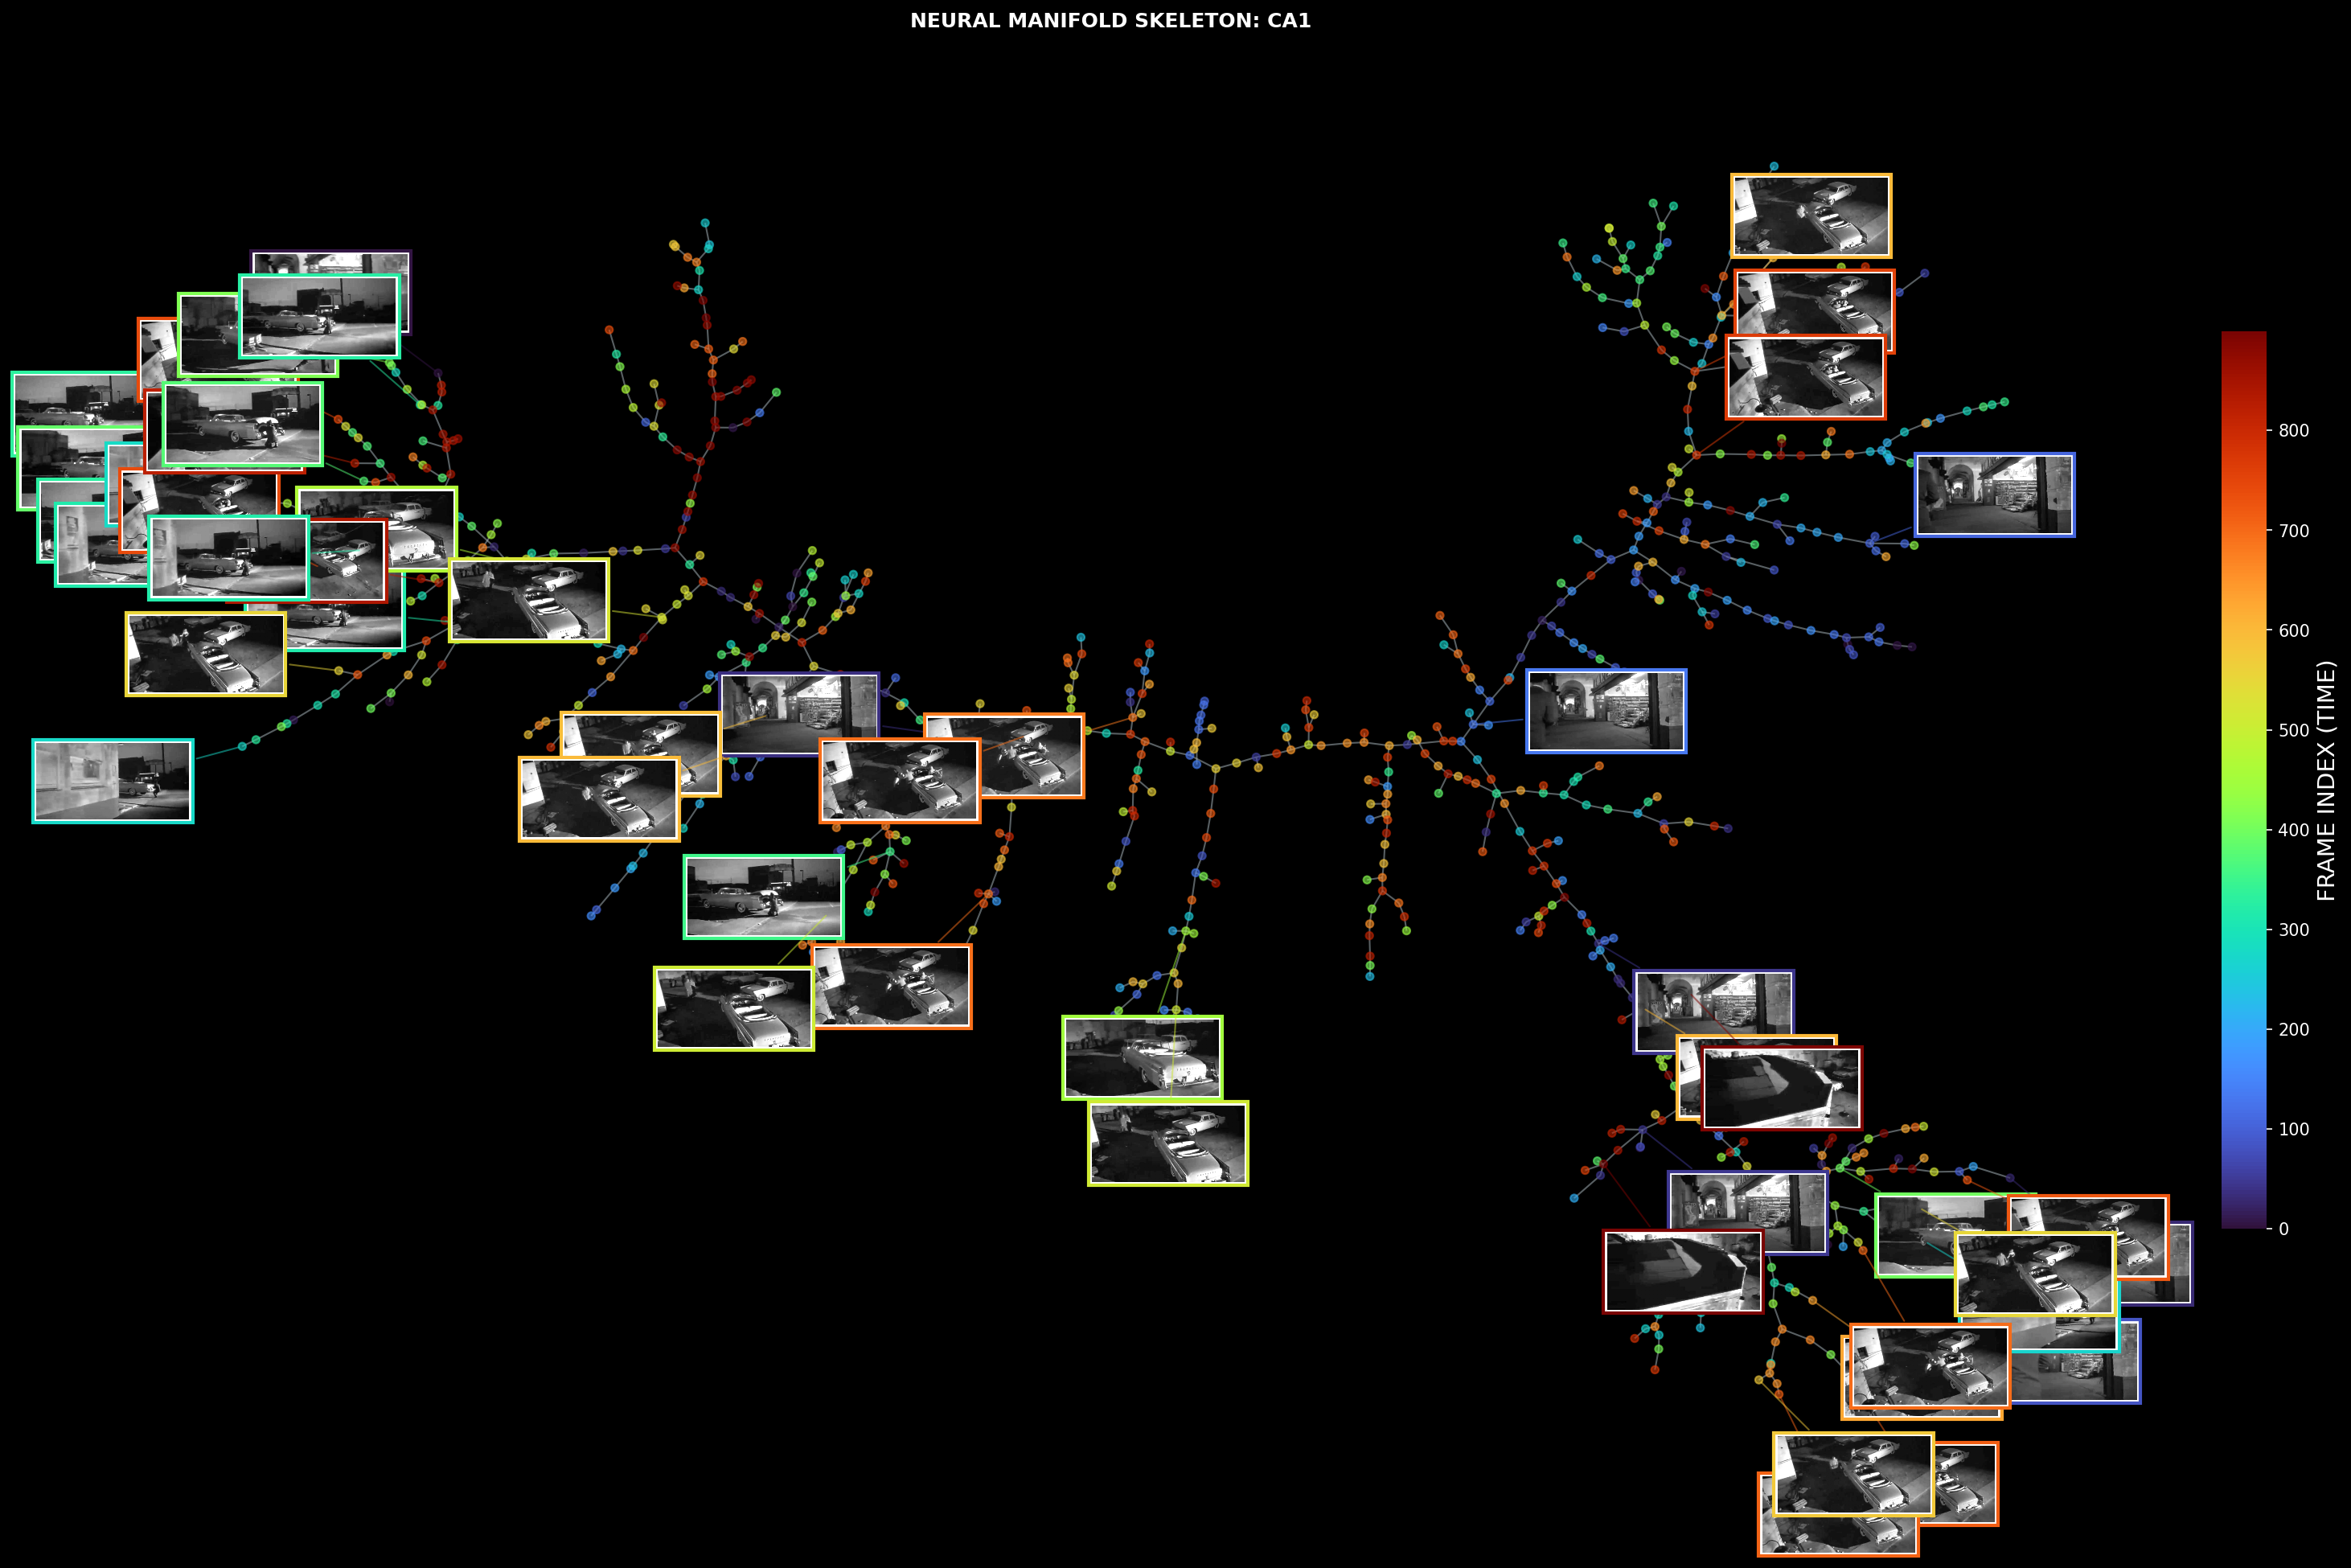
3D tree structures of Primary Visual Cortex (VISp) and Hippocampal CA1 region
Explainability Through Topology
Understanding High-Dimensional Neural Geometry: Traditional correlation analysis can find relationships in brain activity but struggles to interpret their meaning. Topological methods transform abstract neural activity into concrete geometric forms—manifolds, trees, persistence diagrams—that reveal the organizational principles underlying neural computation.
By visualizing neural population codes as manifolds and trees, we make the brain's computational logic accessible and comprehensible. Understanding neural networks requires transforming abstract high-dimensional activity into interpretable geometric forms that bridge mathematical analysis and neuroscientific understanding.
Regional Specialization
Different brain regions exhibit distinct topological architectures reflecting their computational roles. Visual cortical areas reveal feature-processing hierarchies with branching patterns that correspond to different visual attributes (luminosity, complexity, motion). Hippocampal regions show memory-related structures with distinct temporal dynamics.
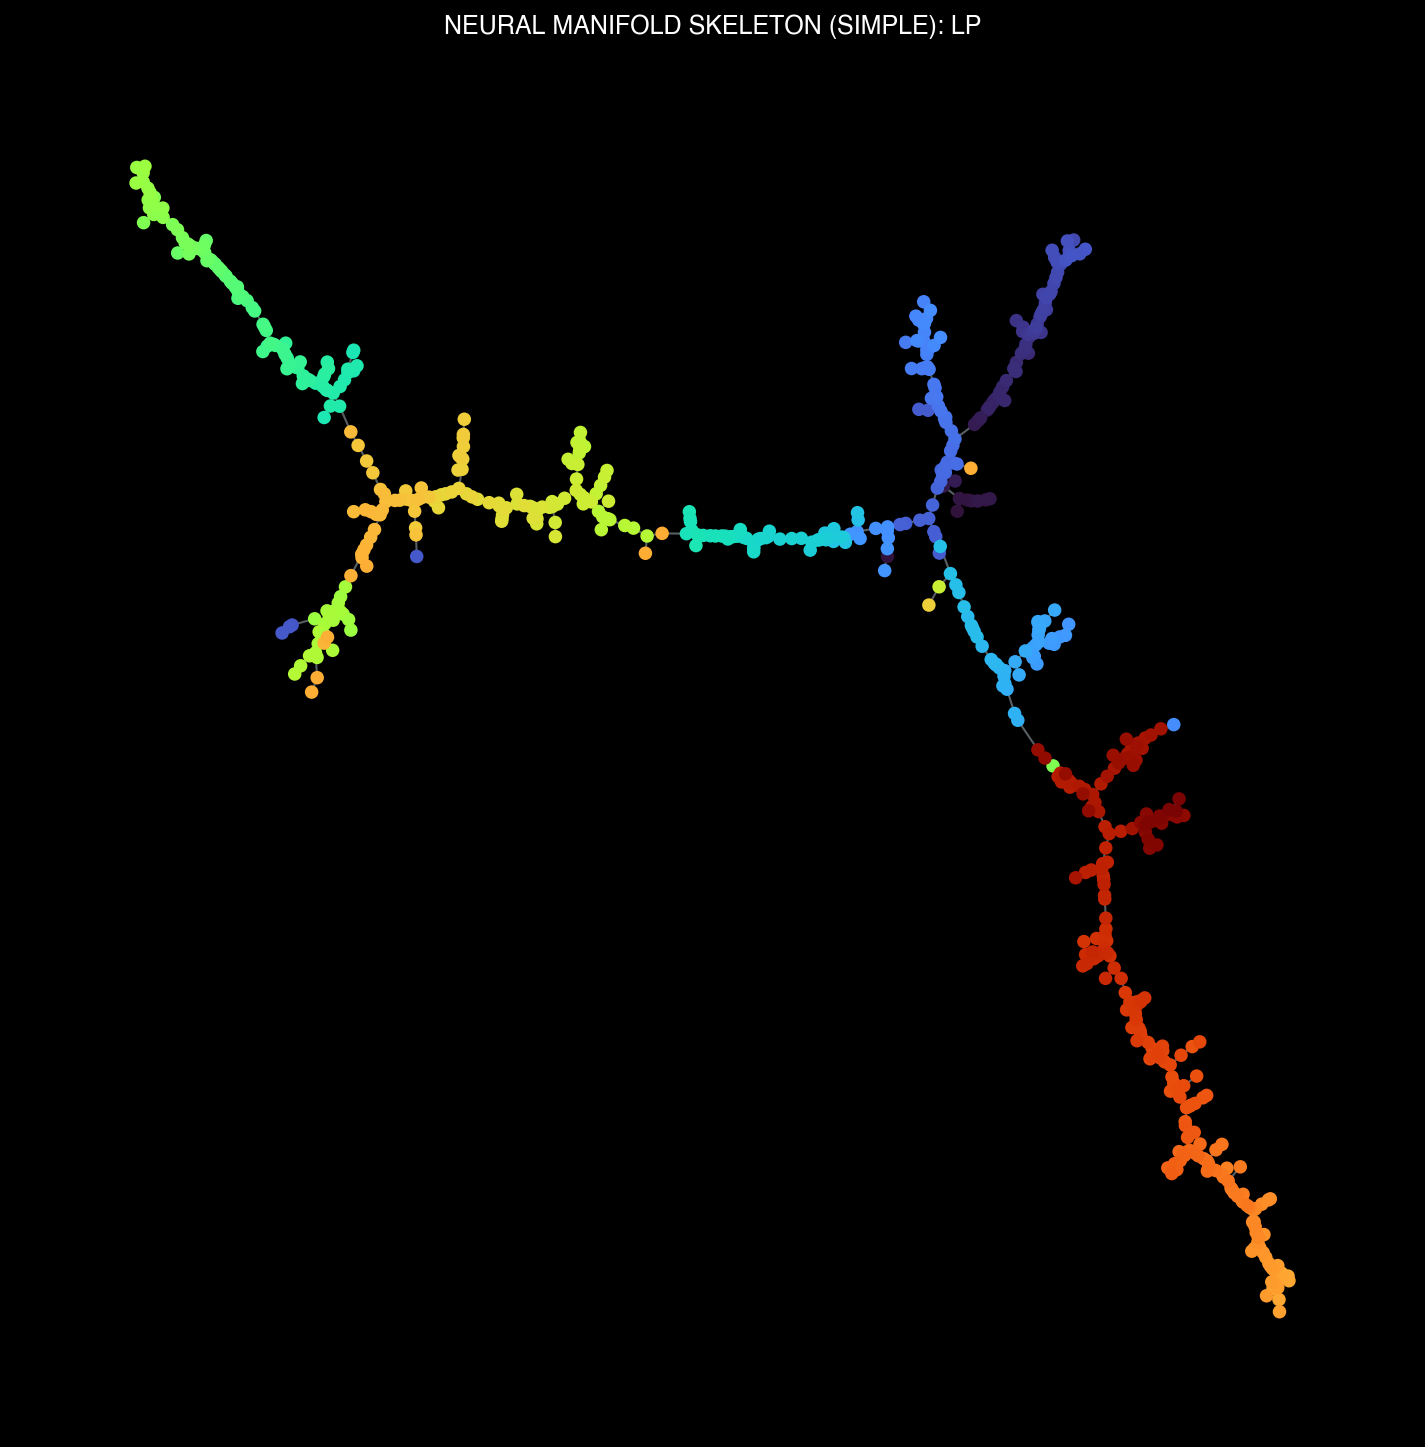
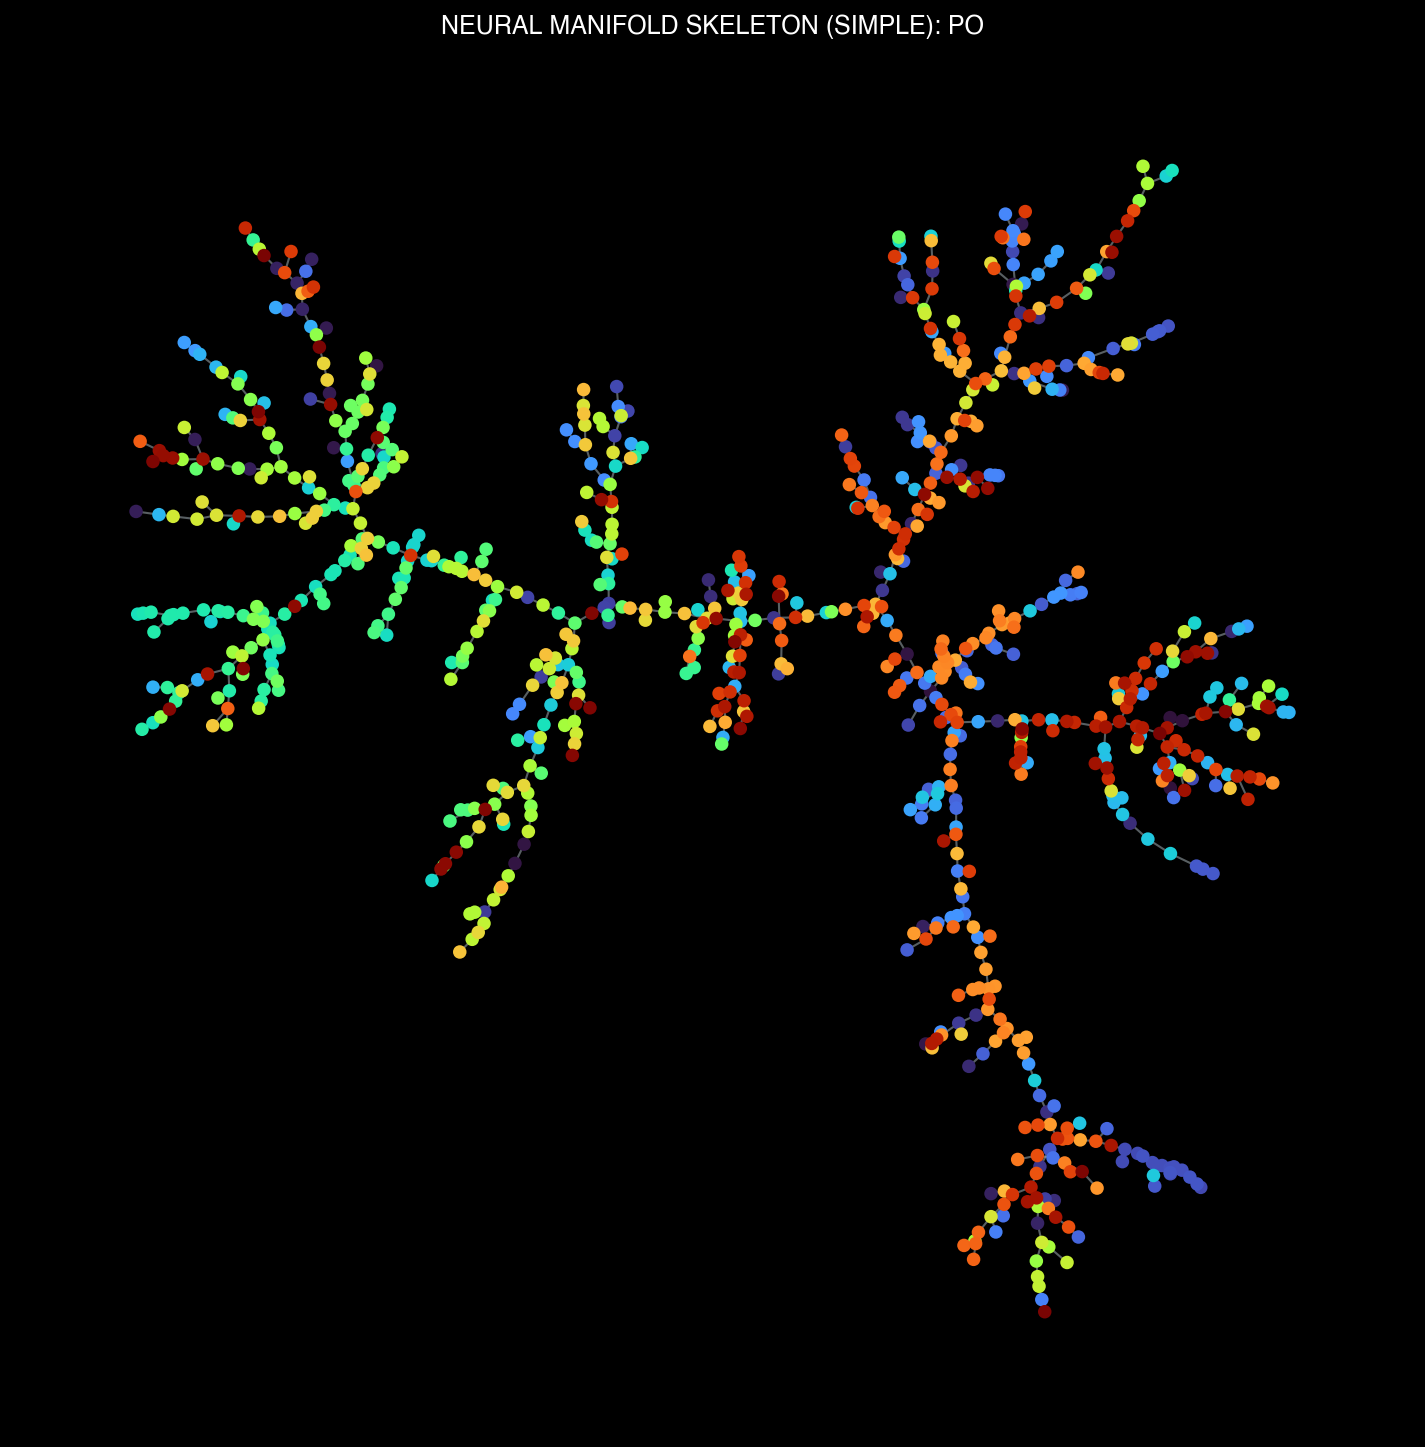
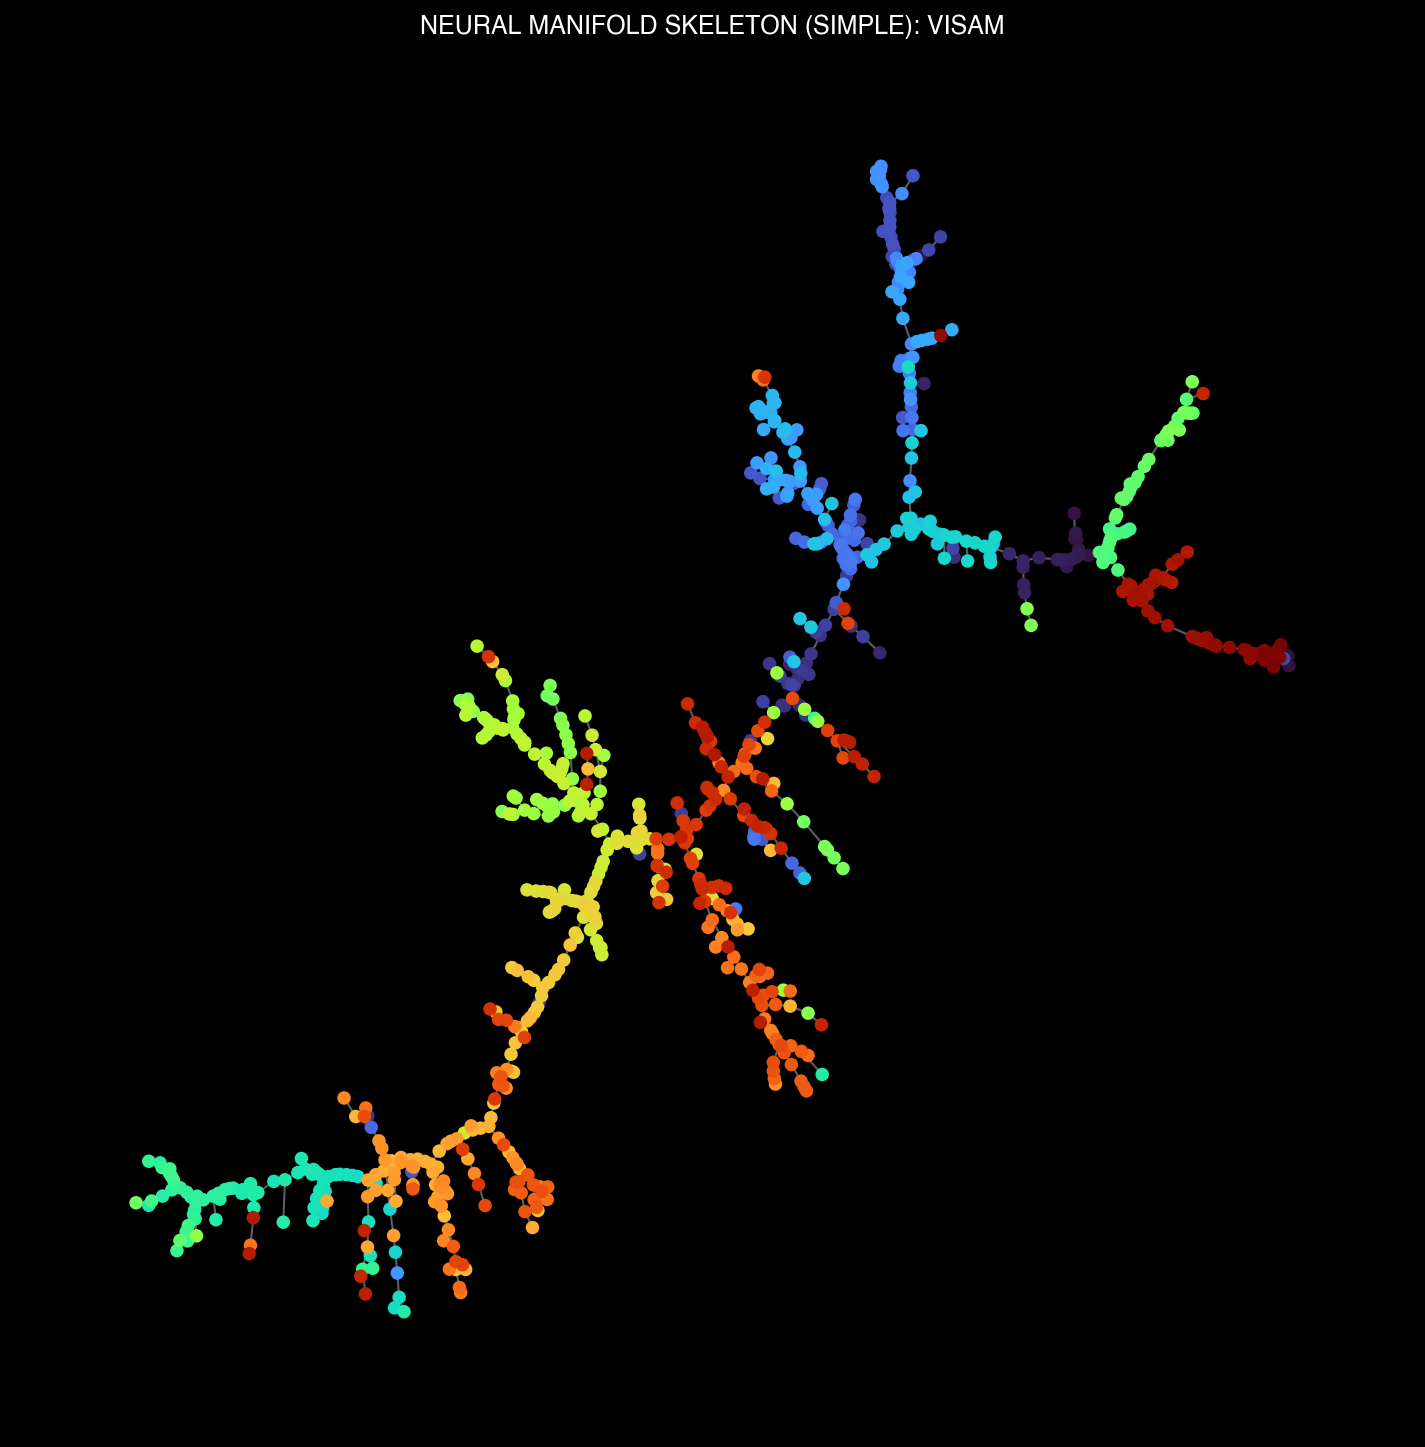
Thalamic (LP, PO) and visual cortical (VISam) manifold structures